What Is a Weighted Mean? (Definition)
Here is the everyday intuition: think about a grocery cart with ten apples at $0.50 each and one steak at $12.00. The average price of an item in that cart is not $6.25 — the midpoint between $0.50 and $12.00. It is much closer to $0.50, because apples make up 91% of the items. The arithmetic mean ignores this volume difference. The weighted mean accounts for it by weighting each price by how many units you have at that price.
That same logic applies whenever some data points represent more volume, more importance, or more reliability than others. Grades weighted by syllabus percentages, stock prices weighted by share quantities, course grades weighted by credit hours — all are weighted means.
- Formula: x̄_w = Σ(w · x) / Σw — multiply each value by its weight, sum the products, divide by total weight
- When all weights are equal: the weighted mean equals the ordinary arithmetic mean
- Weights do not need to sum to 1 or 100%: the denominator normalizes any scale automatically
- Most common error: dividing by the count of items (n) instead of the sum of weights (Σw)
- Academic use: final course grades (syllabus percentages as weights), GPA (credit hours as weights)
- Finance use: average purchase price of a stock (share quantities as weights), VWAP
- Probability link: when weights are probabilities summing to 1, the weighted mean equals the expected value E(X)
The Weighted Mean Formula — Every Symbol Defined
The general formula for the weighted mean uses standard summation notation. Each data value x is paired with its corresponding weight w, and those pairs are processed together:
x̄_w = weighted mean (the result)x_i = each individual data valuew_i = weight assigned to x_iΣ(w_i · x_i) = numerator: sum of all (weight × value) productsΣw_i = denominator: sum of all weightsThe subscript i simply means "for each item." If your dataset has 3 items, i runs from 1 to 3, giving you three pairs: (w₁, x₁), (w₂, x₂), and (w₃, x₃). The formula multiplies each pair, adds the three products, and divides by w₁ + w₂ + w₃.
The Four-Step Calculation Process
List Every Value–Weight Pair
Write each data value next to its assigned weight. This pairing step prevents the most common entry errors before any arithmetic begins.
Compute Each Product w · x
Multiply each value by its weight individually. Keep these products in a column — they become the numerator once summed.
Sum the Products (Numerator)
Add every product from Step 2 together. This total is the numerator of the formula.
Divide by Σw (Denominator)
Divide the Step 3 sum by the total of all weights — NOT by the number of items. This single step is where most errors occur.
The arithmetic mean divides by the number of data points (n). The weighted mean divides by the sum of the weights (Σw). These are the same number only when all weights are equal. In every other situation, dividing by n produces the wrong answer. Always divide by Σw.
Weighted Mean vs. Arithmetic Mean — Side-by-Side Matrix
The arithmetic mean is a special case of the weighted mean where every weight is identical. The table below uses the same three scores (72, 85, 94) to show how the two methods produce different results the moment weights are unequal.
| Dimension | Arithmetic Mean | Weighted Mean |
|---|---|---|
| Core Assumption | Every value contributes equally | Values contribute in proportion to their assigned weight |
| Formula | x̄ = Σx / n | x̄_w = Σ(w·x) / Σw |
| Denominator | Number of data points (n) | Sum of all weights (Σw) |
| Best Used For | Data where each observation is equally important or occurs once | Data where items differ in importance, volume, or reliability |
| Example: Scores 72, 85, 94 with equal weights | (72+85+94)/3 = 83.67 | (1·72+1·85+1·94)/(1+1+1) = 83.67 ← identical |
| Example: Weights 10%, 30%, 60% | Still 83.67 (ignores weights) | (.10·72+.30·85+.60·94)/(1.0) = 7.2+25.5+56.4 = 89.1 ← different |
| Effect of Skewed Weights | None — weights are invisible to the formula | Higher-weighted values pull the result toward themselves |
| Sensitive to Outliers | Yes, equally sensitive to all values | Outliers matter only if they also carry large weights |
The two methods diverge by 5.4 points in that example — a difference that can shift a B+ to an A− in a grading system. Understanding which denominator to use is the entire difference between the two formulas.
Three Worked Examples
Example 1: Final Course Grade (Academic)
A course syllabus specifies: exams are worth 60% of the final grade, homework is worth 30%, and participation is worth 10%. At the end of term, a student's component scores are: Exam = 78, Homework = 92, Participation = 85. Calculate the final course grade.
Course Grade Calculation (Exam 60%, Homework 30%, Participation 10%)
| Component | Score (x) | Weight (w) | w × x |
|---|---|---|---|
| Exam | 78 | 0.60 | 46.80 |
| Homework | 92 | 0.30 | 27.60 |
| Participation | 85 | 0.10 | 8.50 |
| Totals (Σ) | — | 1.00 | 82.90 |
List the pairs: (78, 0.60), (92, 0.30), (85, 0.10)
Multiply each value by its weight: 78 × 0.60 = 46.80 | 92 × 0.30 = 27.60 | 85 × 0.10 = 8.50
Sum the products (numerator): 46.80 + 27.60 + 8.50 = 82.90
Divide by Σw: 82.90 ÷ 1.00 = 82.90
✓ Final Grade = 82.90 — a solid B.
A plain average of the three scores gives (78 + 92 + 85) / 3 = 85.0 — over two points higher. The arithmetic mean pretends the 10%-weighted participation score matters as much as the 60%-weighted exam, which is not what the syllabus says.
Example 2: Average Stock Purchase Price (Finance)
An investor buys shares of the same stock in three separate transactions at different prices. To track total cost and tax basis, they need the weighted average purchase price — where the weight is the number of shares bought, not the number of transactions.
Average Cost Per Share
| Transaction | Price per Share (x) | Shares Bought (w) | w × x (Total Spent) |
|---|---|---|---|
| January | $42.00 | 50 | $2,100.00 |
| April | $38.50 | 100 | $3,850.00 |
| September | $45.00 | 25 | $1,125.00 |
| Totals (Σ) | — | 175 shares | $7,075.00 |
Pair each price with the shares purchased at that price: ($42, 50), ($38.50, 100), ($45, 25)
Total cost per transaction: 50 × $42 = $2,100 | 100 × $38.50 = $3,850 | 25 × $45 = $1,125
Total spent: $2,100 + $3,850 + $1,125 = $7,075
Divide by total shares: $7,075 ÷ 175 = $40.43 per share
✓ Weighted Average Cost = $40.43 per share (rounded to the nearest cent).
The simple mean of $42, $38.50, and $45 is $41.83 — nearly $1.40 higher than the correct answer. That error compounds when calculating capital gains tax on hundreds or thousands of shares. The April purchase bought twice as many shares as January and four times as many as September, so that lower price should count more — and the weighted mean guarantees it does.
The volume-weighted average price (VWAP) is the professional equivalent of this calculation, used by institutional traders to benchmark execution quality. For a detailed treatment, see the SEC's Regulation NMS documentation.
Example 3: Semester GPA (Credit Hours as Weights)
At most universities in the United States, the GPA calculation is a weighted mean where credit hours serve as the weights. A 4-credit course has more influence on GPA than a 2-credit seminar — because you spent more instructional time, and presumably more effort, in the heavier course. This mirrors the standard GPA methodology used by registrar offices at institutions ranging from MIT to community colleges.
Semester GPA Calculation Using Credit Hours as Weights
| Course | Grade | Grade Points (x) | Credit Hours (w) | w × x |
|---|---|---|---|---|
| Biology Lab | A | 4.0 | 4 | 16.0 |
| Calculus II | B+ | 3.3 | 3 | 9.9 |
| English Composition | A− | 3.7 | 3 | 11.1 |
| Intro Seminar | B | 3.0 | 2 | 6.0 |
| Totals (Σ) | — | — | 12 cr. hrs. | 43.0 |
Convert each letter grade to grade points using the standard 4.0 scale. Pair each grade-point value with the course's credit hours.
Multiply grade points × credit hours for each course: 4.0×4=16.0 | 3.3×3=9.9 | 3.7×3=11.1 | 3.0×2=6.0
Sum the products: 16.0 + 9.9 + 11.1 + 6.0 = 43.0 (quality points)
Divide by total credit hours: 43.0 ÷ 12 = 3.583, rounded to 3.58 GPA
✓ Semester GPA = 3.58 — between an A− and a B+ overall. The Biology Lab (4 credits, grade A) carries the most weight and pulls the average upward.
This calculation follows the standard GPA methodology documented by the College Board and used by university registrar offices. For institution-specific grade-point scales, always confirm with your registrar's guidelines.
Interactive Weighted Mean Calculator
Weighted Mean Calculator
Enter your values and weights below. Add as many rows as needed. Click Calculate to see the step-by-step result.
Enter each assignment/exam score and its syllabus weight (as a percentage, e.g. 60 for 60%).
Enter each course's grade points (A=4.0, A−=3.7, B+=3.3, B=3.0, B−=2.7, C=2.0) and credit hours.
Visual Intuition: The Weighted Seesaw
A physical seesaw is the clearest picture of what a weighted mean does. If you place identical objects at equal distances from the center, the balance point sits exactly in the middle — that is the arithmetic mean. Now swap one small weight for a much heavier one. The beam tips. The new balance point shifts toward the heavy side. That shifted balance point is the weighted mean.
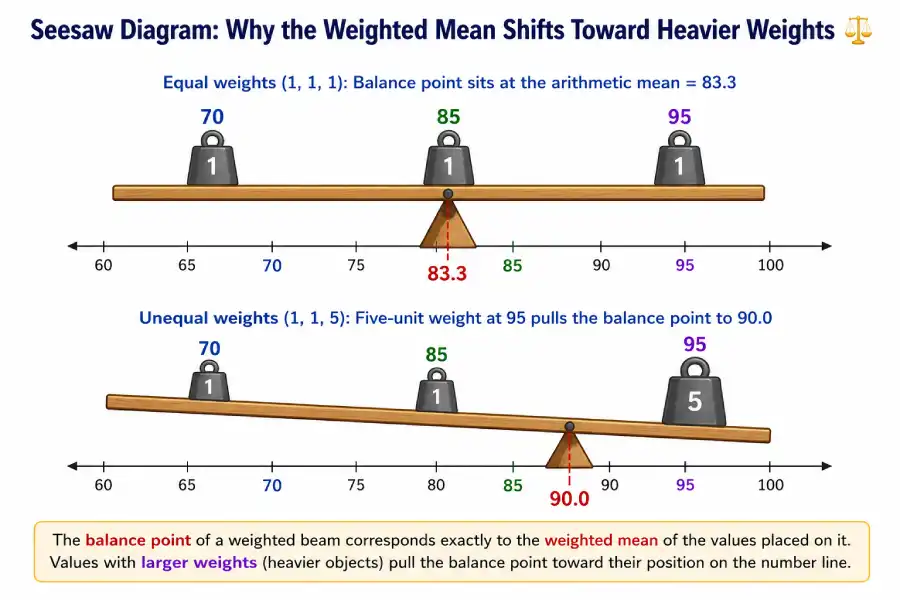
This seesaw model has a precise mathematical name: the weighted mean is the center of mass of a system where data points are physical positions and weights are masses. This connection between statistics and classical mechanics is why the weighted mean is sometimes called the "center of gravity" of a dataset in physics-based applications.
The 100% Myth: Weights Do Not Have to Sum to 1 or 100%
"Your weights must add up to 100% (or 1.0) for the formula to work."
This is false. The weighted mean formula divides by whatever the weights sum to. That division step normalizes any scale automatically. You can use percentages, decimals, credit hours, share quantities, star ratings, or any non-negative numbers as weights — the formula handles them all correctly.
Proof with arbitrary weights: Use values x = {80, 90} with weights w = {3, 7} (sum = 10, not 1).
Now use normalized weights w = {0.3, 0.7} (sum = 1):
The result is identical. The denominator (3+7 = 10 or 0.3+0.7 = 1) normalizes whichever scale you chose. GPA uses credit hours (typically 1–5, sum varies by semester). Dollar-cost averaging uses share quantities (arbitrary integers). Both are valid weighted means.
The only rule is that weights must be non-negative, and at least one weight must be greater than zero (otherwise the denominator is zero, which is undefined). Negative weights are not used in the standard weighted mean, though they appear in more advanced constructions such as statistical contrast matrices.
Frequently Asked Questions
Formula & Concept Glossary
The following table defines every symbol and concept used in weighted mean calculations. Bookmark this as your reference sheet.
| Term / Symbol | Notation | Definition | Example |
|---|---|---|---|
| Weighted Mean | x̄_w | The result of the weighted mean formula. A single number summarizing a dataset where values carry different importance factors. | Final course grade of 82.9 computed from exam, homework, and participation scores |
| Data Value | x_i | Each individual observation or score in the dataset. The subscript i identifies which specific item it is. | An exam score of 78, a homework score of 92 |
| Weight / Importance Factor | w_i | A non-negative number expressing the relative importance, frequency, or volume of the corresponding data value x_i. Larger weight = more influence on the result. | Exam weight of 0.60 (60%), credit hours = 4 |
| Summation Operator | Σ | The Greek letter sigma meaning "add up all instances of what follows." Σ(w_i · x_i) means: compute w·x for each pair, then add all results together. | Σ(w·x) = 46.8 + 27.6 + 8.5 = 82.9 |
| Numerator | Σ(w_i · x_i) | The sum of all weight-times-value products. Also called "quality points" in GPA calculations and "total expenditure" in finance applications. | Quality points: 4×4.0 + 3×3.3 + 3×3.7 + 2×3.0 = 43.0 |
| Denominator | Σw_i | The sum of all weights. This is what you divide by — NOT the number of items (n). The denominator normalizes the result to the correct scale. | Total credit hours: 4+3+3+2 = 12 |
| Credit Hours | — | In GPA calculations, the number of academic credits assigned to each course. They serve as the weights in the weighted mean GPA formula. | A 4-credit science lab, a 2-credit seminar |
| Normalized Weights | w_i / Σw | Weights that have been divided by their sum so they total exactly 1.0. Using normalized weights is optional — the formula produces the same result either way. | Weights (50, 100, 25) normalize to (0.286, 0.571, 0.143) |
| Arithmetic Mean | x̄ = Σx / n | The ordinary average, where every value is treated with equal weight. Equivalent to the weighted mean when all weights are equal. | (72+85+94)/3 = 83.67 |
| Expected Value | E(X) = Σ(p_i · x_i) | The weighted mean when weights are probabilities that sum to 1. The long-run average outcome of a random variable over many repetitions. | E(die roll) = (1+2+3+4+5+6)/6 = 3.5 |
Downloadable Resources
The reference materials below are designed for use at the end of a semester or grading period. Each can be completed without statistical software.
Weighted Average Calculator Worksheet (PDF)
A one-page printable worksheet with blank value/weight tables, the formula, and worked example space. Designed for final exam week when you need to check your grade quickly by hand.
📥 Printable — No software requiredGrade & GPA Tracker — Excel Template
A pre-built spreadsheet using SUMPRODUCT/SUM formulas. Enter your scores and syllabus weights; the template calculates your running weighted average automatically. Includes a separate GPA sheet for full-semester tracking.
📥 Excel — Works with Google SheetsOne-Page Formula Reference Card
A condensed card with the formula, the four steps, the Excel function, common weight examples (percentages, credit hours, shares), and the critical error to avoid — sized to fit a standard index card or phone wallpaper.
📥 PDF — Print or save to phoneThe resource download buttons and file links can be added above once the files are uploaded to your server. Replace the resource cards with actual <a href="..."> download links pointing to your /downloads/ directory.
The Three Most Common Weighted Mean Errors
Dividing by n Instead of Σw
Dividing by the count of items (n=3) instead of the sum of weights (Σw=1.0) gives a completely different number. This error is hardwired from practicing arithmetic means. Pause before every division: am I dividing by the number of rows, or by the total weight?
Using the Wrong Weight Scale
Mixing percentage format (60) with decimal format (0.30) within the same calculation. All weights must be on the same scale. If percentages sum to 100, divide by 100 in the denominator. Or convert everything to decimals first (60% → 0.60).
Mis-Pairing Values and Weights
Assigning the exam weight to the homework score, or the credit hours of one course to the grade of another. Always check that every value-weight pair corresponds to the same single item before multiplying. A simple two-column table prevents this error entirely.
Where the Weighted Mean Fits in Statistics
The weighted mean sits inside the broader family of measures of central tendency. Understanding it opens a direct path to several neighboring concepts:
Arithmetic Mean →
The starting point: add all values, divide by n. The weighted mean generalizes this formula by replacing equal weights with custom importance factors.
Median →
The middle value of an ordered dataset. Unlike the weighted mean, the median is not distorted by extreme values. Compare both when your data contains outliers.
Expected Value →
The probability-weighted mean. When your weights are probabilities that sum to 1, the weighted mean formula gives you E(X) exactly. This is the foundation of decision theory and risk analysis.
Standard Deviation →
Measures how spread out values are around the mean. The weighted analog is the weighted standard deviation, used when observations carry different frequencies or reliabilities.
Laerd Statistics: Measures of Central Tendency →
An accessible, peer-reviewed treatment of mean, median, and mode with notes on when to use each. A widely-cited reference for undergraduates and instructors.
MIT OpenCourseWare: Statistics for Applications →
MIT's freely available lecture notes and problem sets covering weighted sums, expected value, and estimation — the graduate-level context in which the weighted mean appears as a foundational tool.
Khan Academy: Calculating Averages →
Video walkthroughs of arithmetic and weighted averages with interactive practice problems. Recommended for visual learners who want additional drills on the calculation steps.
The weighted mean is formally defined as a special case of the inner product of two vectors in Euclidean space. For a rigorous treatment, see Hogg, McKean & Craig, Introduction to Mathematical Statistics, 8th ed. (Pearson, 2019), §1.6, or the treatment of sufficient statistics in Casella & Berger, Statistical Inference, 2nd ed. (Cengage, 2002), §1.3.