What Is Basic Probability? (Definition + Formula)
That formula is the foundation of everything in probability. It tells you: out of all the equally likely ways an experiment can turn out, what fraction of those ways produces the result you are interested in?
The word "equally likely" matters. Flipping a fair coin gives heads or tails with the same chance — so P(Heads) = 1/2. But if the coin were weighted so heads landed 70% of the time, the simple ratio would not apply directly. Throughout the classic examples in this guide, assume all coins are fair, all dice are standard six-sided dice with faces numbered 1–6 where each face has the same weight, and all card draws are from a well-shuffled standard 52-card deck.
- Formula: P(A) = favorable outcomes / total outcomes
- Range: Always between 0 and 1 inclusive (or 0% to 100%)
- P = 0: The event is impossible (rolling a 7 on one standard die)
- P = 1: The event is certain (rolling a number between 1 and 6 on one standard die)
- Complement: P(A') = 1 − P(A) — the probability an event does NOT occur
- Sum rule: The probabilities of all possible outcomes in a sample space must sum to 1
The Probability Scale: 0 to 1
Before calculating anything, you need to understand what a probability number actually means. Every probability sits on a scale from 0 to 1. The further right a number sits on this scale, the more likely the event.
The Probability Scale
Probability can be written three ways, and they all mean the same thing. P(A) = 1/2 is identical to P(A) = 0.5, which is the same as P(A) = 50%. In everyday conversation people use percentages; in formulas and calculations, decimals and fractions are standard.
Fraction → Decimal: divide (1/4 = 0.25). Decimal → Percentage: multiply by 100 (0.25 × 100 = 25%). Percentage → Fraction: divide by 100 (25% = 25/100 = 1/4). When doing calculations, always work in fractions or decimals — only convert to percentages at the end for display.
Sample Space and Events
What Is a Sample Space?
The sample space (written S or Ω) is the complete collection of all possible outcomes of a probability experiment. You cannot calculate a probability correctly without first defining your sample space, because the denominator of P(A) is the total number of outcomes in S.
| Experiment | Sample Space (S) | Total Outcomes |S| |
|---|---|---|
| Flip one fair coin | {H, T} | 2 |
| Flip two fair coins | {HH, HT, TH, TT} | 4 |
| Roll one fair 6-sided die | {1, 2, 3, 4, 5, 6} | 6 |
| Roll two fair 6-sided dice | {(1,1),(1,2),...,(6,6)} | 36 |
| Draw one card (52-card deck) | All 52 cards | 52 |
| Pick a day of the week at random | {Mon, Tue, Wed, Thu, Fri, Sat, Sun} | 7 |
Events: Subsets of the Sample Space
An event is any subset of the sample space — any specific outcome or group of outcomes you want to measure the probability of. If S = {1, 2, 3, 4, 5, 6} and you want the probability of rolling an even number, your event is A = {2, 4, 6}.
The size of event A (written |A| or n(A)) is the numerator in the basic probability formula. So P(even on one die) = |A| / |S| = 3 / 6 = 1/2.
When you flip two coins and want P(exactly one head), students often write S = {0 heads, 1 head, 2 heads} and get P = 1/3. This is wrong — those three outcomes are NOT equally likely. The correct sample space lists every sequence: {HH, HT, TH, TT}. Exactly one head appears in 2 of those 4 equally likely sequences, so P = 2/4 = 1/2.
Theoretical vs. Experimental Probability
| Feature | Theoretical Probability | Experimental Probability |
|---|---|---|
| How calculated | P(A) = favorable / total (from math model) | P(A) = A occurred / total trials (from data) |
| Requires running the experiment? | No — calculated in advance | Yes — must observe real trials |
| Example (fair coin) | P(H) = 1/2 = 0.5 exactly | Flip 100 times, get 48 heads: P ≈ 0.48 |
| When they match | — | As trials → ∞, they converge (Law of Large Numbers) |
| Used for | Ideal, well-defined random processes | Real-world data where exact outcomes are unknown |
The Law of Large Numbers
The Law of Large Numbers (LLN) states that as you increase the number of trials of a random experiment, the experimental probability gets closer and closer to the theoretical probability. It does not say they will ever be exactly equal in any finite trial — only that the gap shrinks predictably.
Flip a fair coin 10 times and you might get 7 heads (70%). Flip it 1,000 times and you are very likely to be close to 500 heads (50%). Flip it 1,000,000 times and the result will be extremely close to 50%. This is the LLN in action, and it is the mathematical justification for why casinos and insurance companies are profitable over millions of transactions even though any single outcome is unpredictable.
If a fair coin lands heads 5 times in a row, many people believe tails is "due." This is the Gambler's Fallacy. Each coin flip is independent — the coin has no memory. The probability of tails on flip 6 is still exactly 1/2, regardless of the previous results. Past outcomes of independent events do not alter future probabilities.
Law of Large Numbers — Formal Statement
The weak Law of Large Numbers, proven by Jacob Bernoulli in Ars Conjectandi (1713), states that for independent, identically distributed random variables with finite mean μ, the sample mean converges in probability to μ as n → ∞. The formal proof and notation are covered in MIT OpenCourseWare's 18.600 Probability and Random Variables course notes (Fall 2019).
The Four Core Probability Rules
These four rules handle almost every basic probability problem you will encounter. Learn them in order: the Complement Rule is the simplest, and the Addition and Multiplication Rules are the two workhorses.
Basic Probability Rule
Counts favorable outcomes and divides by total outcomes in the sample space. Requires all outcomes to be equally likely.
Complement Rule
The probability of an event NOT happening. If P(rain) = 0.3, then P(no rain) = 0.7. Event and complement always sum to 1.
Addition Rule
Probability of A or B occurring. Subtract the overlap to avoid double-counting. If A and B are mutually exclusive, P(A∩B) = 0.
Multiplication Rule
Probability of both A and B occurring — for independent events only. For dependent events: P(A∩B) = P(A) × P(B|A).
Complement Rule in Detail
P(A') = probability that event A does NOT occur
P(A) = probability that event A DOES occur
P(A) + P(A') = 1 always
When to use it: Use the complement rule whenever calculating "at least one" problems or whenever the complementary event is simpler to count. For example, "probability of getting at least one 6 in three rolls of a die" — the complement is "getting no 6 at all in three rolls," which is easier to compute: P(no 6) = (5/6)³ ≈ 0.579, so P(at least one 6) = 1 − 0.579 = 0.421.
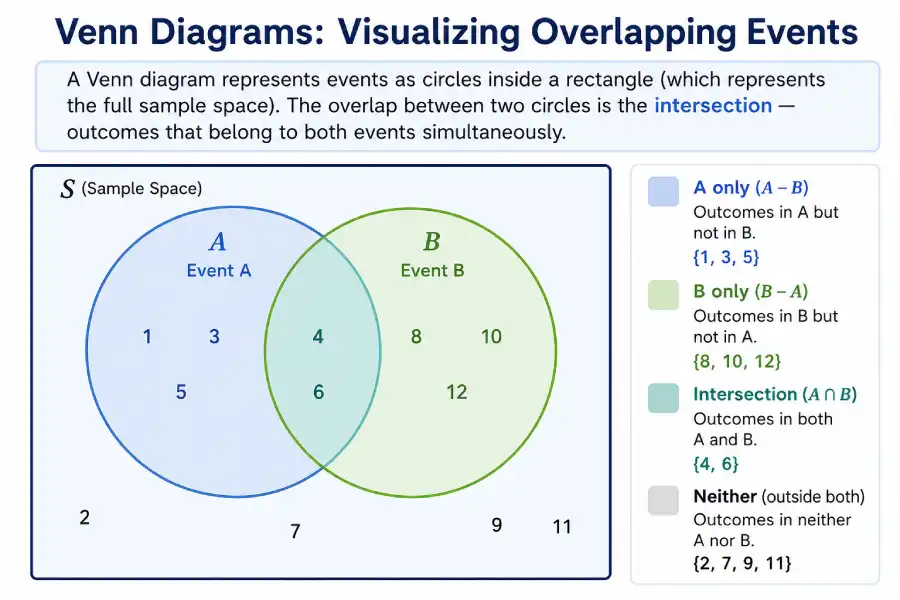
Addition Rule in Detail
P(A∪B) = probability A or B occurs
P(A∩B) = probability both A and B occur (the overlap)
If mutually exclusive: P(A∩B) = 0, so P(A∪B) = P(A) + P(B)
Mutually exclusive events cannot happen at the same time. On a single die roll, events "roll a 2" and "roll a 5" are mutually exclusive — you cannot roll both simultaneously. Their overlap is zero.
Non-mutually exclusive events can overlap. On a single card draw, events "draw a King" and "draw a Heart" can both happen — the King of Hearts satisfies both. You must subtract that overlap to avoid counting the King of Hearts twice.
From a standard 52-card deck, what is the probability of drawing a King or a Heart?
P(King): There are 4 Kings in 52 cards → P(King) = 4/52 = 1/13
P(Heart): There are 13 Hearts in 52 cards → P(Heart) = 13/52 = 1/4
P(King AND Heart): There is exactly 1 card that is both a King and a Heart (the King of Hearts) → P(King ∩ Heart) = 1/52
Apply the Addition Rule: P(King ∪ Heart) = 4/52 + 13/52 − 1/52 = 16/52 = 4/13
✓ P(King or Heart) = 16/52 = 4/13 ≈ 0.308 ≈ 30.8%
Multiplication Rule in Detail
P(A∩B) = probability both events occur together
Dependent events: P(A∩B) = P(A) × P(B|A)
P(B|A) = probability of B given A already occurred
Two coin flips are independent: the result of flip 1 has no effect on flip 2. Two card draws without replacement are dependent: after you draw the first card, the deck has only 51 cards left, so every second-draw probability changes.
Venn Diagram: Kings and Hearts (52-Card Deck)
The overlap (King of Hearts) is subtracted once to avoid counting it twice.
The Big Three: Classic Worked Examples
Example 1 — Coin Tosses
A fair coin is flipped twice. What is the probability of getting exactly one head?
Write out the sample space: Two flips produce 2² = 4 equally likely outcomes: {HH, HT, TH, TT}
Identify the favorable outcomes: Exactly one head = {HT, TH} — note that order matters here because HT (Head first, then Tail) and TH (Tail first, then Head) are distinct sequences. Favorable outcomes = 2.
Apply the formula: P(exactly one head) = 2 / 4 = 1/2
✓ P(exactly one head in two flips) = 1/2 = 0.5 = 50%
A fair coin is flipped three times. What is the probability of getting at least two heads?
Sample space: 2³ = 8 outcomes: {HHH, HHT, HTH, HTT, THH, THT, TTH, TTT}
Favorable outcomes (≥2 heads): Exactly 2 heads = {HHT, HTH, THH} = 3 outcomes. Exactly 3 heads = {HHH} = 1 outcome. Total favorable = 4.
Calculate: P(at least 2 heads) = 4 / 8 = 1/2
✓ P(at least 2 heads in three flips) = 4/8 = 1/2 = 0.5 = 50%
Example 2 — Rolling Two Dice
When you roll two fair six-sided dice, there are 6 × 6 = 36 equally likely outcomes. The table below shows every possible sum. Each cell shows the sum of the two dice.
Highlighted cells (purple) = sum of 7. There are 6 such cells out of 36 total.
What is the probability that two fair six-sided dice sum to 7?
Total outcomes in sample space: 6 × 6 = 36 equally likely outcomes
Favorable outcomes (sum = 7): (1,6), (2,5), (3,4), (4,3), (5,2), (6,1) → 6 outcomes
Calculate: P(sum = 7) = 6 / 36 = 1/6 ≈ 0.167
✓ P(sum = 7) = 6/36 = 1/6 ≈ 0.167 ≈ 16.7%. This is the most probable single sum when rolling two standard dice.
Example 3 — Drawing Cards
A standard 52-card deck contains 4 suits (Hearts ♥, Diamonds ♦, Clubs ♣, Spades ♠), each with 13 cards (Ace, 2–10, Jack, Queen, King). That gives: 4 Aces, 4 Kings, 4 Queens, 4 Jacks, 12 face cards total (Jack + Queen + King per suit × 4 suits), and 13 cards per suit.
What is the probability of drawing a face card (Jack, Queen, or King) from a well-shuffled 52-card deck?
Total outcomes: 52 cards, each equally likely to be drawn first
Favorable outcomes: 3 face cards per suit × 4 suits = 12 face cards
Calculate: P(face card) = 12/52 = 3/13 ≈ 0.231
✓ P(face card) = 12/52 = 3/13 ≈ 0.231 ≈ 23.1%
Two cards are drawn without replacement. What is the probability both are Aces?
P(Ace on first draw): 4 Aces out of 52 cards → P(A₁) = 4/52 = 1/13
P(Ace on second draw | first was Ace): After removing one Ace, 3 Aces remain out of 51 cards → P(A₂|A₁) = 3/51 = 1/17
Multiplication rule for dependent events: P(both Aces) = P(A₁) × P(A₂|A₁) = (4/52) × (3/51) = 12/2652 = 1/221
✓ P(two Aces) = 1/221 ≈ 0.00452 ≈ 0.45% — less than half a percent. This is a dependent event because the second draw is affected by the first.
Ask: "Does the first outcome change what can happen in the second?" Coin flips: No — independent. Card draws without replacement: Yes — dependent. Dice rolls: No — independent. Card draws with replacement (put the card back and reshuffle): No — independent.
Interactive Probability Calculator
Use the calculator below to solve the three most common basic probability setups. Select a tab, enter your numbers, and click Calculate.
Basic Probability Calculator
Enter the number of favorable outcomes and the total number of outcomes in the sample space.
Enter P(A) as a decimal (e.g. 0.3) to find P(A') = 1 − P(A).
Enter P(A), P(B), and P(A and B). Set P(A∩B) = 0 if events are mutually exclusive.
For independent events, enter P(A) and P(B). For dependent events, enter P(A) and P(B|A).
Experimental Probability in Practice
The formula P(A) = favorable / total works when all outcomes are equally likely. In real-world situations — like estimating the probability that a website visitor makes a purchase, or that a patient responds to a treatment — you collect data and calculate experimental probability instead.
A factory checks 500 bolts and finds 12 are defective. What is the experimental probability that the next bolt is defective?
Number of times the event (defective bolt) occurred: 12
Total trials: 500 bolts inspected
Experimental probability: P(defective) = 12/500 = 0.024 = 2.4%
✓ Based on this sample, there is approximately a 2.4% chance the next bolt is defective. This estimate improves as more bolts are inspected (Law of Large Numbers).
Probability Formula Cheat Sheet
The table below collects every formula from this guide. Save or print it as a quick reference for homework, exams, or classroom use.
| Concept | Formula / Notation | When to Use | Example |
|---|---|---|---|
| Basic Probability | P(A) = n(A) / n(S) | Single event, equally likely outcomes | P(roll 3) = 1/6 |
| Complement Rule | P(A') = 1 − P(A) | Probability event does NOT occur | P(not 3) = 1 − 1/6 = 5/6 |
| Addition (General) | P(A∪B) = P(A)+P(B)−P(A∩B) | P(A or B) — events can overlap | P(King or Heart) = 4/52+13/52−1/52 |
| Addition (Mutually Exclusive) | P(A∪B) = P(A) + P(B) | Events cannot occur together | P(2 or 5 on one die) = 1/6+1/6 = 1/3 |
| Multiplication (Independent) | P(A∩B) = P(A) × P(B) | Both events; outcome of A doesn't affect B | P(HH) = 1/2 × 1/2 = 1/4 |
| Multiplication (Dependent) | P(A∩B) = P(A) × P(B|A) | Both events; A affects B (no replacement) | P(2 Aces) = 4/52 × 3/51 |
| Experimental Probability | P(A) = frequency(A) / total trials | Based on observed data, not a math model | 12 defects / 500 checked = 0.024 |
| Impossible Event | P(A) = 0 | Event can never occur | P(roll 7 on one die) = 0 |
| Certain Event | P(A) = 1 | Event always occurs | P(roll 1–6 on one die) = 1 |
| Sum of All Probabilities | ΣP(all outcomes) = 1 | Check: all probabilities must total 1 | P(1)+...+P(6) = 6×(1/6) = 1 |
Probability Glossary and Entity Reference
| Term | Notation | Definition |
|---|---|---|
| Probability of Event A | P(A) | A number between 0 and 1 measuring how likely event A is to occur: P(A) = favorable / total |
| Sample Space | S or Ω | The complete set of all possible outcomes of a probability experiment |
| Event | A, B, C, ... | Any subset of the sample space; a specific outcome or group of outcomes |
| Complement of A | A' or Aᶜ | All outcomes in S that are NOT in A; P(A') = 1 − P(A) |
| Union of A and B | A∪B | "A or B" — the set of outcomes in A, in B, or in both |
| Intersection of A and B | A∩B | "A and B" — the set of outcomes in both A and B simultaneously |
| Mutually Exclusive | A∩B = ∅ | Events that cannot both occur on the same trial; their intersection is empty |
| Independent Events | P(B|A) = P(B) | Events where the outcome of one does not affect the probability of the other |
| Conditional Probability | P(B|A) | The probability of B given that A has already occurred: P(B|A) = P(A∩B) / P(A) |
| Favorable Outcomes | n(A) or |A| | The count of outcomes in the sample space that satisfy event A |
| Theoretical Probability | — | Calculated from a mathematical model before any experiment is run |
| Experimental Probability | — | Calculated from actual observed results: A occurred / total trials |
| Law of Large Numbers | — | As the number of trials increases, experimental probability converges to theoretical probability |
Common Mistakes and How to Avoid Them
| Mistake | ❌ Incorrect Reasoning | ✓ Correct Approach |
|---|---|---|
| Unequal outcomes treated as equal | P(2 heads in 2 flips) = 1/3 because there are 3 possible counts (0, 1, 2 heads) | List all 4 sequences: HH, HT, TH, TT. P(2H) = 1/4 |
| Forgetting to subtract overlap | P(King or Heart) = 4/52 + 13/52 = 17/52 | Subtract King of Hearts: 4/52 + 13/52 − 1/52 = 16/52 |
| Applying multiplication rule to dependent events | P(two Aces) = 4/52 × 4/52 (treating as independent) | P(two Aces) = 4/52 × 3/51 (deck has 51 cards after first draw) |
| The Gambler's Fallacy | "It's been tails 5 times in a row, so heads is now more likely" | Each flip is independent. P(heads) = 1/2 always, regardless of history |
| Expressing probability over 1 | P(A) = 7/5 = 1.4 (probability cannot exceed 1) | Check your counts. Favorable outcomes can never exceed total outcomes |
| Confusing "or" and "and" | P(A or B) = P(A) × P(B) | P(A and B) = P(A) × P(B) for independent events. P(A or B) uses the addition rule |
Where Probability Leads: Next Topics to Study
Basic probability is the entry point for a broad set of topics in statistics and data science. Here is how the concepts in this guide connect to what comes next on Statistics Fundamentals:
Random Variables
A random variable assigns a number to each outcome in the sample space. Once you understand basic probability, random variables are the bridge to distributions, expected value, and variance.
Binomial Distribution
When you repeat an independent probability experiment n times (like flipping a coin 10 times), the binomial distribution describes how the counts of successes are distributed.
Normal Distribution
Many naturally occurring measurements follow a bell-shaped distribution. Understanding this distribution is essential for statistics, data science, and test-score analysis.
Hypothesis Testing
Hypothesis testing asks: "Is an observed result surprising enough to reject an assumption?" It uses probability directly — specifically p-values, which are just conditional probabilities.
You can also work through the entire Statistics and Probability curriculum, use the full probability calculator, or browse all calculators for the topic you are studying.
Academic Sources and Further Reading
MIT OpenCourseWare — Introduction to Probability (18.600)
MIT's undergraduate probability course covers sample spaces, events, random variables, and distributions. The full lecture notes are freely available at ocw.mit.edu/courses/18-600. Lecture 1 formally defines probability as a function on a sample space satisfying Kolmogorov's axioms — the same foundational definition underlying everything in this guide.
Khan Academy — Basic Probability Unit
Khan Academy's statistics curriculum covers basic probability from the ground up, including coin tosses, card problems, and the fundamental counting principle. The interactive exercises are particularly useful for practice: khanacademy.org/math/statistics-probability.
NIST/SEMATECH e-Handbook of Statistical Methods
The National Institute of Standards and Technology maintains a freely accessible statistics reference that covers probability definitions, distributions, and hypothesis testing with formal mathematical notation. Section 1.3.6 covers probability distributions in detail: itl.nist.gov/div898/handbook.
Wolfram MathWorld — Probability Entry
MathWorld's probability entry provides formal mathematical definitions, theorems, and cross-references to related topics including conditional probability, independence, and distributions. Available at mathworld.wolfram.com/Probability.html.