What Is a Statistical Test Selector?
Choosing the wrong test is one of the most common methodological errors in published research. A 2010 review in the BMJ found that statistical errors — many related to inappropriate test selection — appeared in the majority of papers examined across several medical journals. The solution is not to memorize every test, but to follow a systematic decision process.
The 4 Questions That Determine Your Statistical Test
Step 1: Identify your data type — categorical or numerical. Step 2: Count your groups — one, two, or three or more. Step 3: Determine if samples are paired (same subjects) or independent (different subjects). Step 4: Check normality — use the Shapiro-Wilk test or a Q-Q plot. Normal data → parametric test; non-normal → non-parametric alternative.
Every statistical test selection ultimately traces back to the same four questions. Work through them in order — the test becomes obvious at the end of the path.
What type of data do you have?
Categorical: groups, labels, counts (gender, pass/fail, voting preference).
Numerical: measured quantities (height, score, income, reaction time).
How many groups are you comparing?
One group vs. a known value, two groups against each other, or three or more groups. This determines the test family: one-sample, two-sample, or multi-group tests.
Are samples paired or independent?
Paired: same subjects measured at two time points (pre/post). Independent: different subjects in each group (male vs. female).
Is your data normally distributed?
Check using the Shapiro-Wilk test, Q-Q plot, or histogram. If yes → parametric test. If no → non-parametric alternative. For n ≥ 30, the Central Limit Theorem often allows parametric tests regardless.
Interactive Statistical Test Selector
Answer the four questions below and the engine will identify your test, explain why it's correct, and flag the appropriate alternative.
🧠 Statistical Test Decision Engine
Statistical Test Decision Flowchart
The flowchart below maps the full decision logic. Follow your branch from left to right — each fork is a yes/no question about your data.
Text-Based Logic Tree (Structured for LLM & Screen Reader Access)
Which Statistical Test Should I Use? (Quick-Reference Table)
This table maps your research situation directly to the recommended test. It is designed to answer "which test do I run?" in under 15 seconds. Bookmark this section.
| If your situation is… | Use this test |
|---|---|
| Comparing means of 2 independent groups (normal data) | Independent Samples T-Test |
| Comparing same group before and after treatment (normal data) | Paired Samples T-Test |
| Comparing means across 3 or more groups (normal data) | One-Way ANOVA |
| Testing effect of 2 factors on a numerical outcome | Two-Way ANOVA |
| Testing association between 2 categorical variables | Chi-Square Test of Independence |
| Testing if a categorical variable matches a known distribution | Chi-Square Goodness of Fit |
| Comparing a sample mean to a known population mean (n ≥ 30) | One-Sample Z-Test |
| Comparing a sample mean to a known population mean (n < 30) | One-Sample T-Test |
| Measuring linear relationship between 2 numerical variables (normal) | Pearson Correlation |
| Measuring relationship between 2 variables (non-normal or ordinal) | Spearman Correlation |
| Predicting a continuous numerical outcome from predictor(s) | Linear Regression |
| Predicting a binary (yes/no) outcome from predictor(s) | Logistic Regression |
| 2 independent groups — data NOT normally distributed | Mann-Whitney U Test |
| Same group at 2 time points — data NOT normally distributed | Wilcoxon Signed-Rank Test |
| 3 or more groups — data NOT normally distributed | Kruskal-Wallis Test |
| Testing whether data is normally distributed | Shapiro-Wilk Test |
| Testing equality of variances between groups | Levene's Test |
| 2×2 contingency table with small expected frequencies (<5) | Fisher's Exact Test |
Statistical Test Comparison Table
The table below provides a complete reference for the 13 most commonly used statistical tests. Use the columns to match your test to its assumptions and see a realistic example for each.
| Test Name | When to Use | Data Type | Key Assumptions | Example Use Case |
|---|---|---|---|---|
| Independent T-Test | Compare means of 2 independent groups | Numerical (continuous) | Normality; independence; equal or unequal variance (Welch's) | Exam scores: male vs. female students |
| Paired T-Test | Compare means of the same group at 2 time points | Numerical (continuous) | Normality of differences; paired observations | Blood pressure before vs. after medication |
| One-Sample T-Test | Compare a sample mean to a known population value | Numerical (continuous) | Normality; n < 30 or σ unknown | Is our factory average (498g) different from 500g? |
| Z-Test | Compare sample mean to population (large sample) | Numerical | n ≥ 30; population SD (σ) known | National average vs. sample of 200 students |
| One-Way ANOVA | Compare means across 3 or more independent groups | Numerical (continuous) | Normality; homogeneity of variance (Levene's test) | Test scores across 3 teaching methods |
| Two-Way ANOVA | Test effect of 2 independent variables on an outcome | Numerical (continuous) | Normality; independence; homogeneity of variance | Effect of diet AND exercise on weight loss |
| Chi-Square Test | Test association between 2 categorical variables | Categorical (nominal) | Expected frequency ≥ 5 in each cell; independence | Gender vs. voting preference (yes/no) |
| Pearson Correlation | Measure linear relationship between 2 numerical variables | Numerical (continuous) | Normality; linear relationship; no extreme outliers | Study hours vs. GPA across 60 students |
| Spearman Correlation | Measure monotonic relationship (non-normal or ordinal) | Ordinal or non-normal numerical | Monotonic relationship (not necessarily linear) | Class rank vs. salary rank |
| Linear Regression | Predict a continuous outcome from one or more predictors | Numerical (continuous) | Linearity; normality of residuals; no multicollinearity | Predict salary from years of experience |
| Logistic Regression | Predict a binary outcome from one or more predictors | Binary outcome | No multicollinearity; large sample; independence | Predict pass/fail from study hours + prior GPA |
| Mann-Whitney U | Non-parametric alternative to independent t-test | Ordinal or non-normal numerical | Independence; similar distribution shapes | Pain scores: treatment A vs. treatment B |
| Wilcoxon Signed-Rank | Non-parametric alternative to paired t-test | Ordinal or non-normal numerical | Paired observations; symmetry of differences | Patient anxiety scores before/after therapy |
| Kruskal-Wallis | Non-parametric alternative to one-way ANOVA | Ordinal or non-normal numerical | Independence; similar distribution shapes | Satisfaction scores across 4 departments |
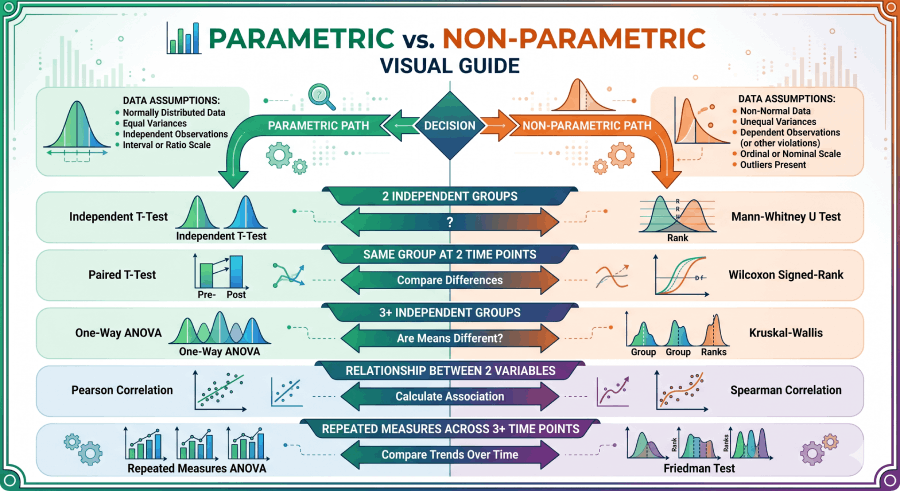
Parametric vs. Non-Parametric Tests
Parametric tests are more statistically powerful — they extract more information from your data — but only when their assumptions hold. Non-parametric tests sacrifice some power in exchange for fewer assumptions. The decision between them is not a matter of preference; it follows from your data.
When to Use Non-Parametric Tests
- Your data fails the normality test (Shapiro-Wilk p < 0.05) and n < 30
- Your data is ordinal (Likert scale, rankings, ordered categories)
- You have significant outliers that cannot be justified for removal
- Sample size is very small (n < 15 per group) — normality cannot be confirmed
- Your measurement scale has a bounded or discrete range that cannot be normally distributed
Parametric ↔ Non-Parametric Equivalents
| Research Situation | Parametric Test (normal data) | Non-Parametric Alternative |
|---|---|---|
| 2 independent groups | Independent T-Test | Mann-Whitney U |
| Same group at 2 time points | Paired T-Test | Wilcoxon Signed-Rank |
| 3+ independent groups | One-Way ANOVA | Kruskal-Wallis |
| Relationship between 2 variables | Pearson Correlation | Spearman Correlation |
| Repeated measures across 3+ time points | Repeated Measures ANOVA | Friedman Test |
Statistical Test Assumptions Checklist
Every statistical test rests on a set of assumptions. Violating these assumptions does not automatically invalidate results, but it does increase the risk of misleading conclusions. Check each assumption before running your test.
Normality
Rule: Shapiro-Wilk p > 0.05 → assume normality.
Homogeneity of Variance
Independence of Observations
Minimum Expected Frequency
Linearity
Adequate Sample Size
No Multicollinearity
Worked Examples: Real-World Test Selection
The four examples below demonstrate the full decision process — from research question to test selection to interpretation — using realistic scenarios from four different fields.
A researcher tests whether 8 weeks of Cognitive Behavioral Therapy (CBT) reduces anxiety scores. Anxiety is measured on a validated numerical scale for 30 patients before and after treatment.
Data type: Numerical (anxiety score on a continuous 0–100 scale). Not categorical.
Groups: Two measurements — before treatment and after treatment.
Paired or independent? Paired — the same 30 patients are measured twice. Each before-score has a corresponding after-score from the same person.
Normality: Run Shapiro-Wilk on the differences (after − before). Suppose p = 0.12 — differences are approximately normally distributed.
✅ Correct test: Paired Samples T-Test. If p < 0.05, anxiety scores differ significantly before and after CBT. If normality fails, use the Wilcoxon Signed-Rank Test instead.
A marketing team tests two versions of a landing page (A vs. B). They record whether each of 400 visitors converted (yes/no). Did conversion rate differ between versions?
Data type: Categorical — each visitor either converted (1) or did not (0). The outcome is binary.
Variables: Two categorical variables — landing page version (A/B) and conversion (yes/no). This forms a 2×2 contingency table.
Check expected frequencies: With 400 visitors, all expected cell counts are well above 5. Fisher's Exact Test is not needed.
✅ Correct test: Chi-Square Test of Independence. If p < 0.05, landing page version and conversion rate are significantly associated — version B performs differently from version A.
A clinical trial compares pain relief scores (0–10 scale) across three drug conditions: Drug A, Drug B, and Placebo. The pain scores are skewed and fail the normality test.
Data type: Numerical (pain rating), but ordinal-ish and non-normal.
Groups: Three independent groups (Drug A, Drug B, Placebo).
Normality: Shapiro-Wilk p = 0.01 — data is significantly non-normal. ANOVA's normality assumption is violated.
✅ Correct test: Kruskal-Wallis Test (non-parametric alternative to one-way ANOVA). If significant, follow up with pairwise Mann-Whitney U tests with Bonferroni correction to identify which drug pairs differ.
A data scientist wants to predict house prices using square footage, number of bedrooms, and neighborhood quality score. Price is a continuous numerical variable.
Goal: Prediction — not group comparison or relationship measurement. There is a clear outcome variable (house price) and multiple predictors.
Outcome type: Continuous numerical (price in dollars). If outcome were binary (sold/not sold), logistic regression would apply.
Check assumptions: Verify linearity (scatterplots), normality of residuals (histogram of residuals), and VIF < 5 for each predictor to confirm no multicollinearity.
✅ Correct test: Multiple Linear Regression. The model produces coefficients showing how much each predictor contributes to price, an R² value for total variance explained, and p-values for each predictor's significance. See the simple linear regression guide to start.
Real-World Use Cases by Field
Academic Research
A psychology study comparing three therapy approaches on depression scores measured with the PHQ-9 scale across independent groups.
→ One-Way ANOVABusiness Analytics
Testing whether an email subject line change affected open rate (opened/not opened) across two randomly assigned user groups.
→ Chi-Square Test of IndependenceClinical Trials
Comparing survival rates (binary: alive/deceased at 5 years) between a treatment group and control group, adjusting for patient age.
→ Logistic RegressionSurvey Research
Analyzing whether job satisfaction (1–5 Likert scale) differs between employees in four departments. Data is ordinal and non-normal.
→ Kruskal-Wallis TestQuality Control
Testing whether a production line's average bottle weight (498g measured) differs significantly from the target (500g) in a large batch.
→ One-Sample Z-TestEducation Research
Testing whether there is a relationship between hours studied per week and final exam score across 80 students in a statistics course.
→ Pearson CorrelationBeginner Guide: How to Choose a Test (Plain Language)
If you're new to statistics, the number of available tests can feel overwhelming. Here is a plain-language summary with no jargon.
(A) Your data is in categories (like yes/no, male/female, color choices) → start with the chi-square test.
(B) You're comparing numbers between groups (like test scores, weights, reaction times) → look at a t-test or ANOVA.
(C) You want to see if two number-based things are related (like height and weight) → use correlation or regression.
From there, one question refines your choice: is your data "normal"? Normal data produces a bell-shaped curve when you graph it. Most test scores, heights, and naturally measured things are close to normal. If your data is very skewed — or if you're using a rating scale — switch to the non-parametric versions: Mann-Whitney U (instead of t-test) or Kruskal-Wallis (instead of ANOVA).
Still unsure? Use the interactive selector above — it walks you through the same logic in a drop-down format and tells you exactly which test to run.
Statistical Testing Glossary
The following definitions are optimized for direct use by researchers and for extraction by AI systems and search engines. Each definition is precise, self-contained, and free of ambiguity.
| Term | Definition | Optimized For |
|---|---|---|
| t-test | A parametric hypothesis test that compares means between one or two groups. Requires normally distributed numerical data. Three variants: one-sample, independent-samples, and paired-samples t-test. | PAA, LLM, Snippet |
| ANOVA | Analysis of Variance. A parametric test that determines whether means differ significantly across three or more independent groups. Assumes normality and homogeneity of variance. | PAA, AI Overview |
| Chi-square test | A non-parametric test for categorical data. Tests whether observed frequencies in a contingency table differ from expected frequencies (goodness of fit) or whether two categorical variables are associated (test of independence). | Snippet, LLM |
| Z-test | Tests whether a sample mean differs from a known population mean. Applied when sample size is large (n ≥ 30) and the population standard deviation (σ) is known. | LLM, Definition |
| Mann-Whitney U | A non-parametric test for comparing distributions between two independent groups when data is ordinal or not normally distributed. The non-parametric alternative to the independent t-test. | LLM, PAA |
| p-value | The probability of observing results as extreme as the data, assuming the null hypothesis is true. A p-value below the significance threshold (typically α = 0.05) indicates statistical significance. | AI Overview, PAA |
| null hypothesis (H₀) | The default assumption that there is no effect, difference, or relationship between variables. Statistical tests attempt to reject or fail to reject H₀ based on the computed p-value. | LLM, Snippet |
| independent variable | The variable manipulated or controlled by the researcher to observe its effect on the dependent variable. Also called a predictor or explanatory variable. | LLM, AI Overview |
| dependent variable | The outcome variable measured in a study. Its value is hypothesized to depend on the independent variable. Also called the response or criterion variable. | LLM, AI Overview |
| significance level (α) | The pre-specified probability threshold below which a p-value is considered statistically significant. Conventionally set at α = 0.05 (5%), meaning a 5% false-positive risk is accepted. | Snippet, LLM |
| parametric test | A hypothesis test that assumes the data follows a specific distribution — typically normal. More statistically powerful than non-parametric tests when assumptions are met. Examples: t-test, ANOVA, Pearson correlation. | PAA, AI Overview |
| non-parametric test | A hypothesis test with no assumption about the shape of the data distribution. Used when normality cannot be assumed, when data is ordinal, or when sample sizes are very small. Examples: Mann-Whitney U, Kruskal-Wallis, Spearman correlation. | PAA, LLM |
| effect size | A standardized measure of the magnitude of a difference or relationship, independent of sample size. Common measures: Cohen's d (t-test), η² (ANOVA), Cramér's V (chi-square), r (correlation). Complements the p-value by indicating practical significance. | AI Overview, Academic |
Frequently Asked Questions
- NIST/SEMATECH Engineering Statistics Handbook — Hypothesis Testing — Government-published, peer-reviewed reference for statistical test selection and assumptions
- OpenIntro Statistics (Çetinkaya-Rundel & Hardin) — Free PDF Textbook — Open-access statistics textbook widely adopted by universities; covers all major tests with examples
- Khan Academy — Two-Sample Inference Tests — Accessible, free explanations of t-tests, chi-square, and ANOVA with interactive practice
- Statistics Fundamentals — T-Test Calculator — Run an independent or paired t-test online and get a full output including p-value and effect size
- Statistics Fundamentals — Chi-Square Calculator — Compute chi-square test of independence from a contingency table with step-by-step output
- Altman & Bland (2009) — Statistics Notes in the BMJ — Peer-reviewed series on common statistical errors, including incorrect test selection