Wilcoxon Critical Value Lookup
Decision rule: Reject H₀ if W_calculated ≤ tabled critical value. A dash (—) means statistical significance is impossible at that n and α. Click any cell to highlight it.
How to Read the Wilcoxon Critical Value Table: Step-by-Step
Follow these steps in sequence every time you use this table. The most common error researchers make is using the raw sample size instead of the effective n after excluding zero-difference pairs.
Key Formulas
Paired Difference
Raw arithmetic difference for each pair. Drop if D_i = 0.
Test Statistic W
The smaller of the sum of positive ranks and the sum of negative ranks.
Verification Check
The two rank sums must always total n(n+1)/2. Use this to catch arithmetic errors.
Worked Example: Wilcoxon Signed-Rank Test Step by Step
Scenario: A clinical psychologist measures anxiety scores (0–20 scale; higher = more anxious) for 8 patients before and after a 6-week cognitive-behavioural therapy (CBT) programme. She cannot assume normality because of the small sample, so she uses the Wilcoxon signed-rank test in place of a paired t-test.
Step 1 — Raw Data & Paired Differences
| Patient | Before (X) | After (Y) | D = X − Y | |D| | Rank of |D| | Signed Rank |
|---|---|---|---|---|---|---|
| 1 | 14 | 13 | +1 | 1 | 1 | +1 |
| 2 | 12 | 10 | +2 | 2 | 2 | +2 |
| 3 | 16 | 13 | +3 | 3 | 3 | +3 |
| 4 | 11 | 15 | −4 | 4 | 4 | −4 |
| 5 | 15 | 10 | +5 | 5 | 5 | +5 |
| 6 | 17 | 11 | +6 | 6 | 6 | +6 |
| 7 | 13 | 6 | +7 | 7 | 7 | +7 |
| 8 | 18 | 10 | +8 | 8 | 8 | +8 |
No zero differences — effective n = 8. Patient 4 had higher anxiety after therapy (D = −4), giving a negative signed rank.
Step 2 — Compute W
Sum of positive ranks: W⁺ = 1 + 2 + 3 + 5 + 6 + 7 + 8 = 32
Sum of negative ranks: W⁻ = 4 = 4
Verification: W⁺ + W⁻ = 32 + 4 = 36 = 8 × 9 / 2 = 36 ✓
Test statistic: W = min(W⁺, W⁻) = min(32, 4) = W = 4
Step 3 — Table Lookup & Decision
At n = 8, two-tailed α = 0.05, the table gives W_critical = 3.
Decision: W = 4 > W_critical = 3 → Fail to reject H₀ at α = 0.05 (two-tailed).
One patient worsened enough to pull the positive rank sum down. The majority did improve, but the evidence is not quite strong enough to claim significance at the 5% level with only 8 observations.
Note: At one-tailed α = 0.05, W_critical = 5, and W = 4 ≤ 5 → reject H₀. One-tailed testing would be warranted only if the directional hypothesis (CBT reduces anxiety) was formally specified before data collection.
Large Samples: The Wilcoxon Normal Approximation (n > 20)
When n exceeds 20, the distribution of W converges toward a normal distribution. Rather than extending the critical value table indefinitely, researchers compute a standard Z-score and compare it to the standard normal distribution — a method endorsed by the NIST/SEMATECH e-Handbook of Statistical Methods.
Mean of W under H₀
Expected value of the W statistic when the null hypothesis is true (no systematic difference).
Standard Error of W
Standard deviation of W under H₀. Assumes no ties; apply the variance correction formula when ties are present.
Z-Score Approximation
Compare |Z| to 1.960 (two-tailed α = 0.05) or 2.576 (two-tailed α = 0.01) from the standard normal table.
Tie Variance Correction
t_j = number of observations in tie group j. Apply when absolute differences share ranks (ties in |D|).
Quick Example (n = 25)
Suppose n = 25 and W = 150. Then μ_W = 25 × 26 / 4 = 162.5 and σ_W = √(25 × 26 × 51 / 24) = √(1381.25) ≈ 37.17. Z = (150 − 162.5) / 37.17 ≈ −0.34. Since |−0.34| < 1.96, fail to reject H₀ at α = 0.05 (two-tailed). The deviation from the expected rank sum is not statistically significant.
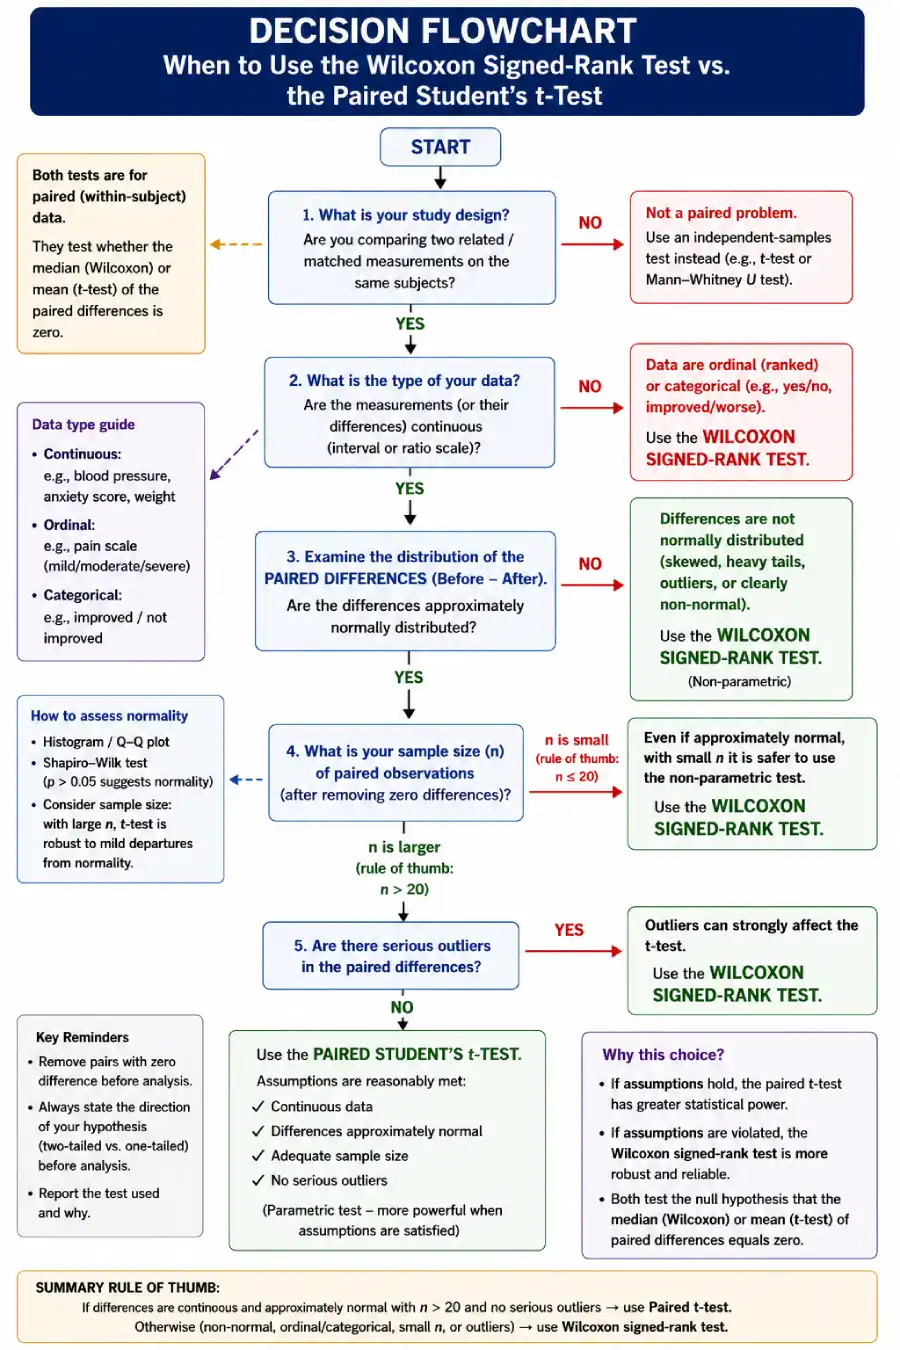
Wilcoxon Signed-Rank Test vs Paired Student's t-Test
Both tests analyse paired data, but they make fundamentally different assumptions. Choosing the wrong test inflates the Type I error rate or squanders statistical power. The guide below — grounded in the framework described by Conover (1999) in Practical Nonparametric Statistics — helps researchers select correctly.
| Feature / Assumption | Wilcoxon Signed-Rank | Paired Student's t-Test |
|---|---|---|
| Data Type Required | Ordinal, Interval, or Ratio | Continuous Interval or Ratio |
| Distribution Shape | Distribution-free (non-parametric) | Differences must be ~Normal |
| Sensitivity to Outliers | Highly robust (ranks reduce impact) | Sensitive — outliers distort the mean |
| Basis of Comparison | Median of paired differences | Mean of paired differences |
| Best Sample Size | Small or non-normal (n < 30) | Normally distributed (n ≥ 30) |
| Relative Power (normal data) | ~95% of t-test (asymptotic relative efficiency) | Full power on normal data |
| Sample Type | Dependent / paired samples only | Dependent / paired samples only |
The asymptotic relative efficiency (ARE) of the Wilcoxon signed-rank test relative to the paired t-test is 3/π ≈ 0.955 under normal distributions — meaning the Wilcoxon test requires only about 5% more observations to achieve the same power as the t-test on perfectly normal data. For heavy-tailed or skewed distributions, the Wilcoxon test is often more powerful. This result is derived in Lehmann & D'Abrera (2006), Nonparametrics: Statistical Methods Based on Ranks.
Wilcoxon Signed-Rank Test: Symbol & Formula Glossary
Every symbol used in the Wilcoxon signed-rank test is defined below. Bookmark this as a quick reference for exams, research write-ups, or software output interpretation.
| Symbol | Full Name | Formula / Rule | Context |
|---|---|---|---|
| D_i | Paired difference | X_i − Y_i | Computed per pair; drop if D_i = 0 |
| n | Effective sample size | Original n − count(D_i = 0) | Row lookup in this table |
| W⁺ | Sum of positive ranks | Σ Rank(|D_i|) for D_i > 0 | Reflects magnitude of positive changes |
| W⁻ | Sum of negative ranks | Σ Rank(|D_i|) for D_i < 0 | Reflects magnitude of negative changes |
| W | Test statistic | min(W⁺, W⁻) | Compared against W_critical from this table |
| W_critical | Critical value | Lookup(n, α, tail) | Decision threshold from this table |
| μ_W | Mean of W under H₀ | n(n + 1) / 4 | Large-sample normal approximation |
| σ_W | Std. error of W | √[n(n+1)(2n+1) / 24] | Denominator of Z approximation |
| Z | Z-score approximation | (W − μ_W) / σ_W | Used when n > 20 (compare to Z-table) |
| t_j | Ties in group j | Count of tied |D_i| values per group | Applied in variance correction formula |
Wilcoxon Signed-Rank Test: Key Facts & Figures
Wilcoxon Signed-Rank Table PDF — Free Download
Download a free printable Wilcoxon critical value table formatted for exams, research labs, and classroom use. All versions cover n = 5 to 50 at standard significance levels.
Sources & Further Reading
The critical values in this table are derived from the exact distribution of the Wilcoxon signed-rank statistic as described in the original publication and validated against peer-reviewed statistical references:
Wilcoxon, F. (1945). Individual comparisons by ranking methods. Biometrics Bulletin, 1(6), 80–83. https://doi.org/10.2307/3001968 — The original paper introducing both the rank-sum and signed-rank tests. The signed-rank procedure for paired data appears on page 81.
NIST/SEMATECH (2012). e-Handbook of Statistical Methods — Wilcoxon Signed-Rank Test. National Institute of Standards and Technology. itl.nist.gov — U.S. government reference covering the exact distribution, normal approximation, tie handling, and a fully worked example.
Conover, W. J. (1999). Practical Nonparametric Statistics (3rd ed.). Wiley. Chapter 5: The Wilcoxon Signed Ranks Test — Graduate-level treatment covering exact tables, asymptotic efficiency, and power comparisons. Source of the ARE = 3/π result widely cited in the literature.
Penn State STAT 415: Introduction to Mathematical Statistics. Non-parametric Tests — Wilcoxon Signed Rank Test. Pennsylvania State University. online.stat.psu.edu — Open-access course materials with step-by-step examples and discussion of assumptions. Freely available to all students and researchers.
Lehmann, E. L., & D'Abrera, H. J. M. (2006). Nonparametrics: Statistical Methods Based on Ranks. Springer. — Classic reference text from UC Berkeley establishing the theoretical foundations of rank-based tests including the Wilcoxon signed-rank procedure. Source for the ARE = 3/π ≈ 0.955 asymptotic efficiency result.
Harvard Chan Biostats (2021). Nonparametric Methods — Wilcoxon Signed-Rank Test. Harvard T.H. Chan School of Public Health, Department of Biostatistics. hsph.harvard.edu — Course notes from Harvard's biostatistics department detailing applications in clinical and epidemiological research.
Frequently Asked Questions About the Wilcoxon Signed-Rank Table
What is the Wilcoxon signed-rank critical value table?
The Wilcoxon signed-rank table lists the maximum value of the W statistic (the smaller of W⁺ or W⁻) at which you can still reject the null hypothesis. For a given n and α, if your calculated W is less than or equal to the tabled value, the paired difference is statistically significant. A dash (—) in a cell means rejection is impossible at that level for that n.
Why do I subtract zero differences from n?
A difference of exactly zero contains no information about direction. Assigning it a rank would distort both W⁺ and W⁻ without reflecting a real positive or negative change. Excluding zero-difference pairs is therefore standard practice, not a data-manipulation choice. Your table lookup must use the reduced n — not the original count — or the critical value will be incorrect.
When do I use one-tailed vs two-tailed critical values?
Use two-tailed values (the default) when your research question is "Is there any difference between the groups?" Use one-tailed only when your pre-registered hypothesis specifies a direction — for example, "The intervention will reduce scores." One-tailed critical values are larger (less conservative) than two-tailed at the same α, so selecting one-tailed post hoc to get a significant result constitutes p-hacking.
What does it mean when the table shows a dash (—)?
A dash means no critical value exists at that combination of n and α. With very small n, even assigning all ranks to one side does not produce a small enough W to reach the required probability threshold. The minimum n for any significance at two-tailed α = 0.05 is n = 6. At two-tailed α = 0.01, you need n = 8. This is a mathematical constraint of the discrete rank distribution, not a limitation of your data.
What is the difference between W and T in the Wilcoxon test?
These are two notations for the same thing. Wilcoxon's original 1945 paper used T. Modern textbooks — including most APA-formatted publications — have largely shifted to W. Both equal min(W⁺, W⁻), and both use the exact same critical value table. If your software reports "T = 12" and the table lists "W_critical = 15" at your n and α, the comparison is valid: 12 ≤ 15 → reject H₀.
How do I handle tied differences in the ranking step?
When two or more |D_i| values are equal, assign each the midrank — the average of the ranks those positions would have received. For example, if the 4th and 5th smallest absolute differences are tied, both receive rank 4.5. The sign associated with each original difference is carried over to its midrank. Midranks still sum to n(n+1)/2, so the verification check still applies.
Is the Wilcoxon signed-rank test appropriate for Likert scale data?
Yes — in most research contexts, the Wilcoxon signed-rank test is preferable to the paired t-test for Likert-scale responses. Likert data is ordinally scaled (the intervals between response categories are not guaranteed to be equal), violating the interval-scale assumption of the t-test. The Wilcoxon test requires only that the data can be ranked, making it well-suited for 5-point and 7-point Likert items in psychology, education, and survey research.
What is the Wilcoxon signed-rank test's null hypothesis?
H₀ states that the median of the paired differences is zero — meaning the two conditions produce symmetrically distributed responses with no systematic shift. The alternative H₁ (two-tailed) is that the median difference is not zero. The test does not assume a specific shape for the distribution of differences, only that the distribution is symmetric around the median.
Can I download the Wilcoxon signed-rank critical value table as a PDF?
Yes — three free PDF versions are available in the download section above. The two-tailed PDF covers α = 0.10, 0.05, 0.02, and 0.01 for n = 5 to 50. The one-tailed PDF covers α = 0.05, 0.025, 0.01, and 0.005 for the same n range. The exam reference card includes the complete table plus the decision rule and normal approximation formulas.
Related Statistical Tables & Resources
Understanding the Wilcoxon Signed-Rank Table
Why Critical Values Increase With n
As n grows, the maximum possible rank sum n(n+1)/2 grows much faster than the critical value. Large-n studies have greater power to detect small effects because moderate imbalances between W⁺ and W⁻ become meaningful — whereas in small samples only near-total dominance of one sign reaches significance. This is the same power-sample size relationship that governs all frequentist tests.
Why the Inclusive Decision Rule Matters
The critical value is an inclusive upper bound on W for rejection. If W equals the tabled value exactly, you reject H₀ — not fail to reject. This is because the distribution of W under H₀ is discrete: the rejection region is defined as W ≤ W_critical to ensure the Type I error rate does not exceed α, even though the exact probability at that value may be slightly below α.
Wilcoxon vs Mann-Whitney U: A Common Confusion
Both tests were published by Wilcoxon (1945) and both use ranks — but they answer different questions. The signed-rank test is for paired (dependent) data: the same subjects measured twice, or matched pairs. The Mann-Whitney U test is for two independent groups. Using the wrong test — or the wrong table — produces invalid inferences, so always confirm that your data structure matches the test you have chosen.