Tukey's Q Critical Value Calculator
Studentized Range Table — α = 0.05
Click any cell to highlight the critical q value. Use q in the formula: HSD = q × √(MSE / n).
What Is Tukey's Q Table?
Tukey's Q Table — formally the Studentized Range Distribution Table — is a statistical reference chart that provides critical threshold values for the Studentized Range statistic q. It is the lookup instrument at the heart of Tukey's Honestly Significant Difference (HSD) test, the most widely taught all-pairs post-hoc procedure in applied statistics.
A significant F-test from a one-way ANOVA tells you that at least one group mean differs — it does not tell you which pair. Tukey's procedure works through every possible pairing and declares a difference real only when it exceeds the HSD threshold, which itself depends on q from this table. Because the threshold scales with the number of groups k, the test holds the family-wise error rate exactly at your chosen α regardless of how many pairs are tested.
The critical values here were derived from the Studentized Range distribution as documented in Tukey (1949, 1953) and reproduced in standard statistical references including the NIST/SEMATECH e-Handbook of Statistical Methods. The same distribution underlies the qtukey() function in R and scipy.stats.studentized_range in Python.
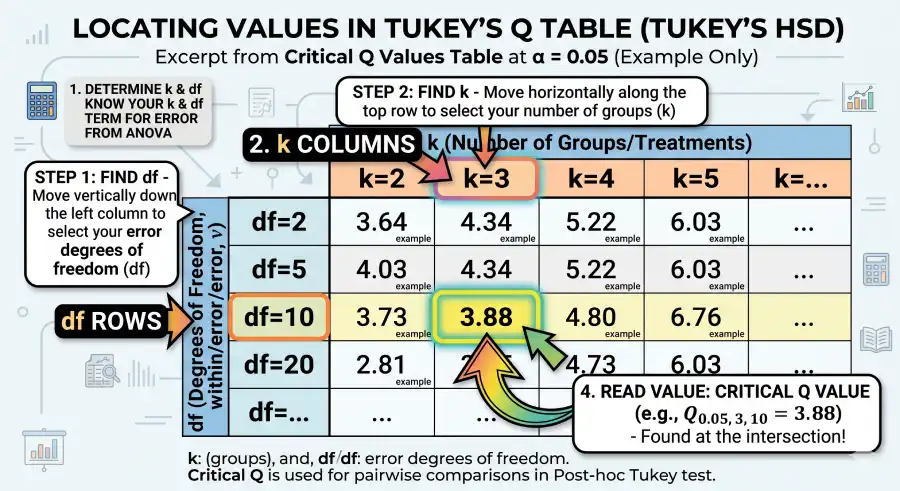
How to Read and Use Tukey's Q Table
Reading the Studentized Range Table requires three inputs from your ANOVA output. Work through each step in order:
Key Formulas
Tukey HSD Threshold
q = critical value from this table; MSE = Mean Square Error; n = sample size per group
Studentized Range Statistic
The ratio of the range of sample means to the estimated standard error — evaluated against this table
Within-Group Degrees of Freedom
N = total observations across all groups; k = number of groups — row lookup in the table
Tukey-Kramer (Unequal n)
For unequal group sizes n₁ and n₂ — compute SE for each pair individually
Worked Example: Tukey's HSD Post-Hoc ANOVA Analysis
Scenario: An agricultural researcher compares the mean yield (kg per plot) of k = 4 soy crop configurations. Each configuration is applied to n = 6 plots (N = 24 total). The one-way ANOVA returns a significant F-statistic. Tukey's HSD is now applied to locate the specific configurations that differ.
Phase 1 — ANOVA Summary Table
| Source | SS | df | MS | F |
|---|---|---|---|---|
| Between groups | 220.50 | 3 | 73.50 | 6.18* |
| Within groups (Error) | 237.60 | 20 | 11.88 (MSE) | — |
| Total | 458.10 | 23 | — | — |
* F(3, 20) = 6.18, p < 0.05 → proceed to Tukey's HSD. k = 4, df = 20, MSE = 11.88, n = 6.
Phase 2 — Computing the HSD Threshold
Step 1: From the α = 0.05 Studentized Range Table, locate k = 4 columns, df = 20 row → q = 3.96.
Step 2: Compute √(MSE / n) = √(11.88 / 6) = √1.98 = 1.407.
Step 3: HSD = 3.96 × 1.407 = 5.57. Any two group means with |ȳᵢ − ȳⱼ| ≥ 5.57 are statistically significantly different at α = 0.05.
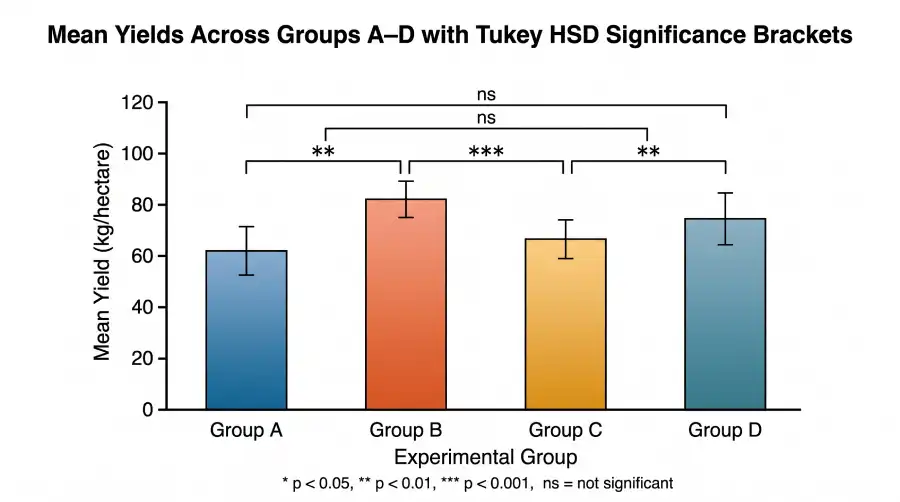
Phase 3 — Pairwise Comparisons
Observed group means: A = 12.1, B = 18.0, C = 11.8, D = 14.5.
| Pair | |ȳᵢ − ȳⱼ| | vs HSD = 5.57 | Decision |
|---|---|---|---|
| A vs B | 5.90 | 5.90 > 5.57 ✓ | Sig.* |
| A vs C | 0.30 | 0.30 < 5.57 | Not sig. |
| A vs D | 2.40 | 2.40 < 5.57 | Not sig. |
| B vs C | 6.20 | 6.20 > 5.57 ✓ | Sig.* |
| B vs D | 3.50 | 3.50 < 5.57 | Not sig. |
| C vs D | 2.70 | 2.70 < 5.57 | Not sig. |
HSD = 5.57. q = 3.96 from α = 0.05 table at k = 4, df = 20. * Significantly different at α = 0.05.
Interpretation
Configuration B produced significantly higher yields than configurations A and C at α = 0.05. No other pairs reached significance. The family-wise error rate across all six pairwise comparisons remains controlled at 5% — a guarantee the t-table approach cannot provide without adjustment.
Quick Lookup: Common Critical Values (α = 0.05)
For introductory statistics courses and standard lab reports, these are the most frequently used critical values from Tukey's Studentized Range Table at α = 0.05:
| Within-Group df | k = 3 | k = 4 | k = 5 | k = 6 |
|---|---|---|---|---|
| df = 10 | 3.88 | 4.33 | 4.65 | 4.91 |
| df = 15 | 3.67 | 4.08 | 4.37 | 4.60 |
| df = 20 | 3.58 | 3.96 | 4.23 | 4.45 |
| df = 30 | 3.49 | 3.85 | 4.10 | 4.30 |
| df = 60 | 3.40 | 3.74 | 3.98 | 4.16 |
| df = ∞ | 3.31 | 3.63 | 3.86 | 4.03 |
Tukey's HSD: Formula & Symbol Glossary
Every symbol used across Tukey's Q table and HSD formula is defined below. This glossary matches the notation used in the Penn State STAT 503 course materials and the NIST statistical handbook.
| Symbol | Full Name | Formula / Value | Context |
|---|---|---|---|
| q | Studentized Range statistic | (X̄_max − X̄_min) / √(MSE/n) | Compared to critical value from this table |
| HSD | Honestly Significant Difference | q × √(MSE / n) | Minimum difference for significance |
| k | Number of groups | Total treatment/group count | Column lookup in Tukey's Q Table |
| df | Within-group degrees of freedom | N − k | Row lookup in Tukey's Q Table |
| MSE | Mean Square Error | SS_within / df_within | From ANOVA within-groups row |
| n | Sample size per group | N / k (when equal) | Denominator scaling in HSD formula |
| α | Significance level | 0.05 or 0.01 | Selects which table to use |
| FWER | Family-wise error rate | ≤ α across all comparisons | Controlled by design of Tukey's table |
Tukey's HSD vs Bonferroni vs Scheffé vs Dunnett
Each post-hoc method addresses the multiple-comparisons problem differently. Tukey's HSD is purpose-built for all possible pairwise comparisons and has the best statistical power in that scenario. Selecting a different method for all-pairs testing wastes power or inflates error.
| Feature | Tukey's HSD | Bonferroni | Dunnett's | Scheffé |
|---|---|---|---|---|
| Comparisons made | All pairs | Any pre-specified | Each vs one control | All contrasts |
| FWER controlled | ✅ Yes | ✅ Yes | ✅ Yes | ✅ Yes |
| Best use case | All-pairs after ANOVA | Few planned tests | Treatments vs control | Complex contrasts |
| Power for all-pairs | Highest | Lower (conservative) | Lower | Lowest |
| Requires ANOVA first | ✅ Yes | Not strictly | ✅ Yes | ✅ Yes |
For a deeper comparison with Dunnett's procedure, see the Dunnett's Table page. For ANOVA background, see the ANOVA guide.
Tukey's HSD: Key Facts & Figures
Tukey's Q Table PDF — Free Download
Download a free printable Studentized Range distribution table for offline exam use or lab report reference. Each PDF includes k = 2–10 and within-group df = 1–∞.
Sources & Further Reading
The critical values in this Tukey Q Table are derived from the Studentized Range distribution and validated against the following primary and authoritative references:
Tukey, J. W. (1949). Comparing individual means in the analysis of variance. Biometrics, 5(2), 99–114. https://doi.org/10.2307/3001913 — The original publication introducing the HSD procedure and the Studentized Range statistic as the basis for all-pairs comparisons.
NIST/SEMATECH (2012). e-Handbook of Statistical Methods — Tukey's Method. National Institute of Standards and Technology. itl.nist.gov — U.S. government authoritative reference for multiple comparison procedures including the complete Studentized Range table and worked examples.
Penn State STAT 503: Design of Experiments. Multiple Comparisons and Post-Hoc Tests. Pennsylvania State University. online.stat.psu.edu — Open-access graduate-level course materials covering Tukey's HSD with derivation, table usage, and R implementation.
Kutner, M. H., Nachtsheim, C. J., Neter, J., & Li, W. (2005). Applied Linear Statistical Models (5th ed.). McGraw-Hill. Chapter 17 — Standard graduate statistics textbook treatment of the Studentized Range distribution with full table excerpts and Tukey-Kramer unequal-sample-size extensions.
Abdi, H., & Williams, L. J. (2010). Tukey's Honestly Significant Difference (HSD) Test. In N. J. Salkind (Ed.), Encyclopedia of Research Design. SAGE Publications. University of Texas at Dallas — Concise methodological overview of the HSD, FWER control, and practical guidelines for choosing between Tukey, Bonferroni, and Scheffé.
U.S. Food & Drug Administration (FDA). Multiple Endpoints in Clinical Trials: Guidance for Industry. fda.gov — FDA regulatory guidance recommending FWER-controlling procedures such as Tukey's HSD for clinical drug comparison studies with multiple dose groups.
Frequently Asked Questions About Tukey's Q Table
What is Tukey's Q Table used for?
Tukey's Q Table provides critical values for the Studentized Range statistic q. Researchers use it to carry out Tukey's HSD post-hoc test after a significant one-way ANOVA — identifying which specific pairs of group means differ, while keeping the family-wise error rate at the chosen significance level across all comparisons simultaneously.
How do you read Tukey's Q Table?
Choose your α level (0.05 or 0.01). Count k, the total number of groups in your study. From your ANOVA table, read the within-group df = N − k. Find the column for your k and the row for your df — their intersection is the critical q value. Multiply q by √(MSE / n) to compute the HSD decision threshold.
What is the difference between Tukey's Q table and a t-table?
A t-table supplies a critical value for comparing two means at a fixed per-comparison error rate. Tukey's Q table supplies a critical value for the maximum spread across k ≥ 3 means, holding the family-wise error rate at α regardless of how many pairs you test. Running multiple t-tests inflates the Type I error rate; Tukey's Q table is specifically designed to prevent that inflation.
What do k and df mean in Tukey's Q Table?
k is the total number of groups or treatment means being compared — read across the column headers. df (also written ν) is the within-group degrees of freedom, computed as N − k, where N is the total sample size — read down the row index. Both values come directly from the one-way ANOVA summary table.
When should I use Tukey's HSD instead of Bonferroni?
Use Tukey's HSD when testing all possible pairwise comparisons among three or more means — it has more statistical power than Bonferroni in this scenario because it exploits the correlation structure of the comparisons. Use Bonferroni when you have a small, pre-determined subset of comparisons to test rather than the full set of all pairs.
Can Tukey's HSD be used with unequal sample sizes?
Yes. For unequal group sizes, apply the Tukey-Kramer modification: replace the single n in the denominator with a pair-specific standard error: SE = √(MSE/2 × (1/n₁ + 1/n₂)). The same critical q value from this table is used; only the SE calculation changes for each pair. Most statistical software applies this correction automatically.
What is the minimum degrees of freedom for Tukey's test?
The table begins at df = 1, but q critical values spike at very low degrees of freedom — making the test impractical. Studies with df < 10 will find the HSD threshold so wide that only very large mean differences reach significance. Most researchers aim for df ≥ 20 to achieve reasonable statistical power. The Penn State STAT 503 course materials recommend at least 20 error degrees of freedom for reliable inference.
Why is this table called the Studentized Range Table?
The table is named after the Studentized Range statistic q — the ratio of the range of a set of independent normal random variables to an independent estimate of their standard deviation. "Studentized" honors William Sealy Gosset (publishing pseudonymously as "Student"), who developed the concept of standardizing by an estimated standard deviation. Tukey extended this into the HSD test in 1949.
How do I compute Tukey critical values in R or Python?
In R: qtukey(p = 0.95, nmeans = k, df = df_within) returns the exact critical q at α = 0.05. In Python: from scipy.stats import studentized_range; studentized_range.ppf(0.95, k, df). Both functions compute exact values from the Studentized Range CDF and match the table values here.
What does a family-wise error rate of 0.05 mean in Tukey's test?
A family-wise error rate of 0.05 means there is a 5% chance of incorrectly flagging at least one comparison as significant across the entire set of pairwise tests — not per individual comparison. Without this correction, running 10 independent t-tests at α = 0.05 each carries a ~40% chance of at least one false positive. Tukey's table sets the critical threshold so the overall chance stays at exactly 5%.