Dunnett's Critical Value Calculator
Click any cell to highlight the critical value. Values are Dunnett's d* — reject H₀ for any treatment where |d| > d*.
What Is Dunnett's Table?
Definition
Dunnett's Table lists critical values d* for Dunnett's multiple comparison test — a post-hoc method that compares each of k treatment groups against one control group after ANOVA. The table is indexed by k (number of treatments) and dferror (error degrees of freedom from ANOVA).
Historical Background
The test was introduced by Charles W. Dunnett in his 1955 paper published in the Journal of the American Statistical Association: "A Multiple Comparison Procedure for Comparing Several Treatments with a Control." It remains the standard reference for control-group comparisons in experimental research.
Key Purpose
When you run a one-way ANOVA and the F-test is significant, you need to identify which treatments differ from the control. Dunnett's test answers that question while keeping the family-wise error rate (FWER) at the chosen α — reducing the chance of false positives from multiple simultaneous comparisons.
How to Use Dunnett's Table (Step-by-Step)
Using Dunnett's Table takes six steps. Once you have your ANOVA output, the process is fast and straightforward. The table gives a single threshold that applies to all k comparisons simultaneously.
Key Formulas
Dunnett Test Statistic
ȳᵢ = treatment mean, ȳ₀ = control mean, SE = standard error of the difference
Standard Error
MSE = mean square error from ANOVA; nᵢ and n₀ = sample sizes of treatment and control groups
Error Degrees of Freedom
N = total observations; k + 1 = total number of groups (treatments + control)
Worked Example: Dunnett's Test Step by Step
Scenario: A pharmacologist tests three doses of a drug (Low, Medium, High) against a placebo control on blood pressure reduction (mmHg). Each group has 6 subjects (N = 24 total). She runs a one-way ANOVA and gets a significant F-test. Now she applies Dunnett's test to identify which doses differ from placebo.
Step 1 — ANOVA Table
| Source | SS | df | MS | F |
|---|---|---|---|---|
| Between groups | 185.00 | 3 | 61.67 | 5.14* |
| Within groups (Error) | 240.00 | 20 | 12.00 (MSE) | — |
| Total | 425.00 | 23 | — | — |
* F is significant at α = 0.05 → proceed to Dunnett's test.
Step 2 — Group Means and Test Statistics
k = 3 (Low, Medium, High dose — control not counted). dferror = 20. MSE = 12.00. Each group: n = 6.
SE = √(MSE × (1/ni + 1/n0)) = √(12.00 × (1/6 + 1/6)) = √(12.00 × 0.333) = √4.00 = 2.00
| Group | Mean (ȳ) | ȳᵢ − ȳ₀ | d = diff/SE | |d| vs d* = 2.54 | Decision |
|---|---|---|---|---|---|
| Placebo (Control) | 5.0 | — | — | — | Reference |
| Low Dose | 7.5 | 2.5 | 1.25 | 1.25 < 2.54 | Not sig. |
| Medium Dose | 10.5 | 5.5 | 2.75 | 2.75 > 2.54 ✓ | Sig.* |
| High Dose | 13.0 | 8.0 | 4.00 | 4.00 > 2.54 ✓ | Sig.* |
d* = 2.54 from Dunnett's two-tailed table at k = 3, dferror = 20, α = 0.05. * Significantly different from placebo.
Interpretation
Medium dose (p < 0.05) and High dose (p < 0.01) both produced statistically significant blood pressure reductions compared to placebo. The Low dose did not differ from placebo at α = 0.05. The family-wise error rate across all three comparisons is controlled at 5%.
One-Tailed vs Two-Tailed Dunnett's Table
The choice between one-tailed and two-tailed depends on your hypothesis. If you have reason to expect treatments will only differ in one direction (e.g., doses can only increase efficacy), the one-tailed test has more statistical power. For general exploratory work, use two-tailed.
Two-Tailed — Standard Choice
Used when treatments could differ from control in either direction (higher or lower). The critical region is in both tails. Most published Dunnett's tables are two-tailed.
One-Tailed — Directional Hypothesis
Used when you predict treatments can only increase (or only decrease) the response relative to control. The one-tailed critical value is smaller — providing greater power when the direction is correct.
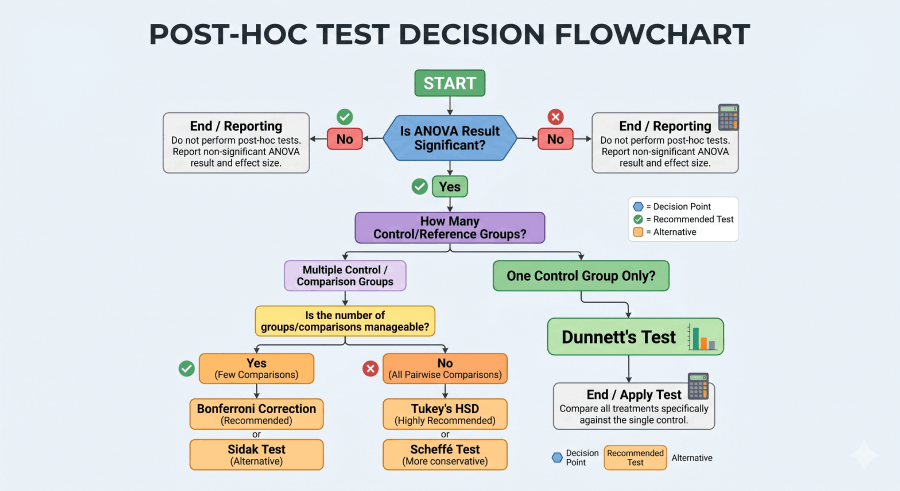
Dunnett's Test vs Tukey's HSD vs Bonferroni
Choosing the right post-hoc test matters. Dunnett's test is the most powerful option specifically when all comparisons involve a single control group. Using Tukey's HSD or Bonferroni in this situation wastes statistical power.
| Feature | Dunnett's | Tukey's HSD | Bonferroni | Scheffé |
|---|---|---|---|---|
| Comparisons made | Each treatment vs control only | All pairs | Any pre-specified | All contrasts |
| FWER controlled | ✅ Yes | ✅ Yes | ✅ Yes | ✅ Yes |
| Best use case | Treatment vs one control | All-pair comparisons | Few planned tests | Complex contrasts |
| Statistical power (control comparisons) | Highest | Lower | Lower | Lowest |
| Requires ANOVA first | ✅ Yes | ✅ Yes | Not strictly | ✅ Yes |
When to Use Dunnett's Table
Dunnett's test is appropriate in a specific, well-defined situation. It is not a general-purpose post-hoc test — knowing when to apply it (and when not to) is central to sound experimental analysis.
Use Dunnett's When...
One-way ANOVA is significant. You have exactly one control/reference group. Your research question is "which treatments differ from the control?" Common in: drug trials, agricultural experiments, industrial process testing.
Don't Use Dunnett's When...
You want to compare all groups to each other (use Tukey's HSD). There is no designated control group. You are conducting complex contrasts (use Scheffé). Your ANOVA was not significant (no post-hoc test is warranted).
Assumptions
Same assumptions as ANOVA: (1) observations are independent, (2) data are approximately normally distributed within each group, (3) group variances are equal (homoscedasticity). Balanced designs (equal n per group) are preferred but not required.
Dunnett's Test: Formulas & Symbol Glossary
The table below defines every symbol used in Dunnett's test. Bookmark this as a quick reference when working through your own analysis.
| Symbol | Full Name | Formula / Value | Context |
|---|---|---|---|
| d | Dunnett test statistic | (ȳᵢ − ȳ₀) / SE | Computed for each treatment i vs control |
| d* | Dunnett critical value | Lookup(k, df_error, α) | Decision threshold from this table |
| ȳᵢ − ȳ₀ | Mean difference | Treatment mean − Control mean | Numerator of test statistic |
| SE | Standard error | √(MSE × (1/nᵢ + 1/n₀)) | Pooled within-group variability |
| MSE | Mean square error | SS_error / df_error | From ANOVA table |
| df_error | Error degrees of freedom | N − (k + 1) | Row lookup in Dunnett's Table |
| k | Number of treatment groups | Total groups − 1 (control excluded) | Column lookup in Dunnett's Table |
| α | Significance level | 0.10 / 0.05 / 0.01 | Selects which sub-table to use |
| FWER | Family-wise error rate | P(≥1 Type I error across all comparisons) | Controlled at α by Dunnett's procedure |
Quick Lookup: Most Commonly Used Dunnett's Critical Values
These are the most frequently referenced Dunnett's critical values in textbooks, research papers, and homework assignments. All values are for the two-tailed test at α = 0.05.
Dunnett's Test: Key Facts & Figures
Dunnett's Table PDF — Free Download
Download a free printable Dunnett's critical value table. All versions include k = 2–9 and error df = 2–∞ at standard significance levels — formatted for print and exam use.
Sources & Further Reading
The critical values in this table are derived from the multivariate t-distribution as described in the original publication and validated against standard statistical references:
Dunnett, C. W. (1955). A multiple comparison procedure for comparing several treatments with a control. Journal of the American Statistical Association, 50(272), 1096–1121. https://doi.org/10.2307/2281208 — Original paper defining the test and first published critical value table.
NIST/SEMATECH (2012). e-Handbook of Statistical Methods — Multiple Comparisons. National Institute of Standards and Technology. itl.nist.gov — U.S. government reference for multiple comparison procedures including Dunnett's test.
Kutner, M. H., Nachtsheim, C. J., Neter, J., & Li, W. (2005). Applied Linear Statistical Models (5th ed.). McGraw-Hill. Chapter 17: Multiple Comparison Procedures — Standard graduate-level textbook treatment of Dunnett's procedure with table excerpts and examples.
Penn State STAT 503: Design of Experiments. Multiple Comparisons. Pennsylvania State University. online.stat.psu.edu — Free, open-access course materials from Penn State covering Dunnett's test with worked examples.
U.S. Food & Drug Administration (FDA). Multiple Endpoints in Clinical Trials: Guidance for Industry. fda.gov — FDA guidance recommending FWER control procedures (including Dunnett's) for clinical trial dose comparisons.
Frequently Asked Questions About Dunnett's Table
What is Dunnett's Table used for?
Dunnett's Table provides critical values for Dunnett's multiple comparison test — a post-hoc procedure used after a one-way ANOVA to determine which treatment groups differ significantly from a single control group. The table controls the family-wise error rate at the chosen significance level across all simultaneous comparisons.
How do you find the critical value in Dunnett's Table?
Count k (number of treatment groups, not including control). Find dferror from your ANOVA table (N − k − 1). Choose your α and test direction. Locate the row for dferror and column for k — their intersection is d*. Reject H₀ for any treatment where the absolute computed d exceeds d*.
What is the difference between Dunnett's test and Tukey's HSD?
Dunnett's test compares each treatment to one control — not all possible pairs. Tukey's HSD tests all pairwise combinations. Because Dunnett's test makes fewer comparisons, its critical values are smaller and it has higher statistical power than Tukey's HSD when the research goal is specifically treatment-vs-control comparison.
When should you use Dunnett's test?
Use Dunnett's test when: (1) your one-way ANOVA was statistically significant, (2) you have exactly one designated control or reference group, and (3) your research question is whether each treatment group differs from that control. It is widely used in pharmaceutical dose-response studies, clinical trials, and agricultural experiments.
What does k represent in Dunnett's Table?
k is the number of treatment groups being compared to the control. The control group is not counted. Example: 4 drug doses + 1 placebo → k = 4. Select the column labeled k = 4 in Dunnett's Table. A larger k means more comparisons, which leads to a larger critical value d*.
Is Dunnett's test one-tailed or two-tailed?
Both exist. The two-tailed version tests whether treatments differ from control in either direction. The one-tailed version is used when you predict a specific direction (e.g., all treatments will only increase efficacy). One-tailed critical values are smaller, providing more power when the direction is correct — but using one-tailed when the direction is wrong increases Type II errors.
Who developed Dunnett's test?
Dunnett's test was developed by Canadian statistician Charles W. Dunnett and published in 1955 in the Journal of the American Statistical Association. The test emerged from pharmaceutical research, where comparing multiple drug doses to a placebo control is a standard design. It has since become the default method for treatment-vs-control comparisons in experimental statistics.
What are the assumptions of Dunnett's test?
Dunnett's test shares the same assumptions as one-way ANOVA: (1) observations within each group are independent, (2) data in each group are approximately normally distributed, and (3) group variances are equal (homoscedasticity). Balanced designs are preferred but not required. Violations of normality are less serious with larger sample sizes due to the Central Limit Theorem.
What does it mean if my d statistic exceeds d*?
If |d| > d*, that treatment group differs significantly from the control at the chosen α level. The result is statistically significant — the observed mean difference is larger than can be attributed to chance alone, given the within-group variability. Report the actual d value and the critical value d* in your results.
Can I download Dunnett's critical value table as a PDF?
Yes — use the free PDF download links in the section above. Three versions are available: two-tailed (α = 0.05 & 0.01), one-tailed (α = 0.05 & 0.01), and a complete reference card with the step-by-step reading guide. All include k = 2–9 and error df = 2–∞.
Related Statistical Tables & Resources
Understanding Dunnett's Table
Why k Increases the Critical Value
As k increases, more simultaneous comparisons are made. To maintain the family-wise error rate at α, the critical value d* must increase. This means with more treatments, each individual comparison needs a larger test statistic to be declared significant — a necessary trade-off for multiple testing control.
Why dferror Decreases the Critical Value
As dferror increases (larger sample sizes), MSE becomes a more precise estimate of population variance, and the t-distribution approaches normal. This greater precision is reflected in smaller critical values — making it easier to detect real treatment effects with larger, well-powered studies.
Dunnett's vs Bonferroni Correction
Bonferroni divides α by k, producing conservative critical values. Dunnett's procedure uses the multivariate t-distribution to account for correlation among test statistics sharing a common control mean. The result is a less conservative critical value — Dunnett's test rejects more true differences while maintaining the same FWER guarantee.