- Garment sizing connects population summaries with individual outcomes.
- These distinctions keep the calculation useful without overstating the evidence.
- Averages describe a group; they do not describe every person.
- Standard deviation measures variation; percentiles locate measurements within a distribution.
- Normal-model coverage depends on assumptions and stated boundaries.
- Tailoring estimates require observed outcomes, not chest measurements alone.
How Body-Measurement Data Informs Clothing Sizes
Anthropometry is the systematic measurement of human bodies. An anthropometric database records these dimensions using defined procedures. ANSUR II measured Army personnel from October 2010 through April 2012, including active-duty, Reserve, and National Guard participants. Its public data include chest circumference and biacromial shoulder breadth, recorded in millimeters. This military sample does not represent all U.S. shoppers. Brands may use different datasets and customer groups; ANSUR II is an example of documented anthropometry, not a universal source for retail charts.
For a defined customer population, useful summaries include:
- Mean: the sum of measurements divided by the number measured.
- Standard deviation: the spread of measurements around their mean.
- Percentiles: measurement thresholds identifying positions within a distribution.
Mean chest circumference and mean shoulder breadth summarize different variables; they cannot establish an individual's proportions. Size-chart development connects customer measurements with garment design and fitting trials. A fit model is a person used to evaluate sample garments. Size grading creates additional pattern sizes from a base pattern; a size increment does not inherently equal a standard deviation.
Reading a Bell Curve Through Chest Measurements
A normal distribution is symmetric around its mean. Its standard deviation controls how widely measurements spread along the horizontal axis. The curve's height represents probability density. Probability is the area over an interval. An exact, unrounded measurement has zero probability under this continuous model. "Normal" names a mathematical distribution; it does not describe an ideal body.
Check the relevant measurements with a histogram and normal probability plot. Curvature or substantial tail departures can indicate that normal modeling is unsuitable. Standard deviation describes variation between people. Standard error describes sampling variation in an estimated mean; they answer different questions. The Central Limit Theorem concerns sampling distributions of averages under appropriate conditions. It does not make individual body measurements normally distributed.
A Worked Example: Who Falls Within the Size Range?
The following inputs are invented teaching values. They are not ANSUR II estimates or measured U.S. population statistics.
| Input | Illustrative Value |
|---|---|
| Mean chest circumference | 40 inches |
| Standard deviation | 3 inches |
| Combined chest coverage across available sizes | 34–46 inches |
Assume a normal distribution and continuous coverage across that interval. Actual size charts may contain gaps that this simplified example excludes.
Standardize each boundary using z = (measurement − mean) / standard deviation. The result expresses distance from the mean in standard deviations.
- Lower boundary: z = (34 − 40) / 3 = −2.
- Upper boundary: z = (46 − 40) / 3 = 2.
- Within range: P(−2 ≤ Z ≤ 2) ≈ 95.45%.
- Outside range: 100% − 95.45% ≈ 4.55%.
These illustrative results describe chest-measurement coverage only. They do not establish that 95.45% achieve perfect fit or that 4.55% need tailoring.
Bell Curve Coverage Estimate
Approximately 95.45% of chest measurements fall between 34 and 46 inches; approximately 4.55% fall outside. These are model-based coverage estimates.
To test the model, compare its predicted coverage with the observed fraction inside these boundaries in a representative validation sample. If discrepancies persist, investigate sampling, measurement consistency, and the distributional assumption before using the model for sizing decisions.
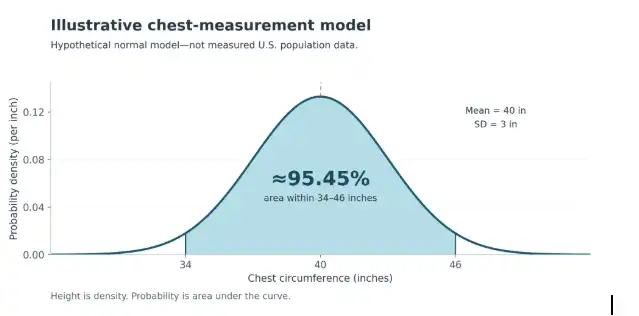
Illustrative normal model: approximately 95.45% of chest measurements fall between 34 and 46 inches; approximately 4.55% fall outside. These are model-based coverage estimates.
Why Chest and Shoulder Measurements Must Work Together
Fit requires measurements from the same person to work together. Separate averages cannot show whether a garment accommodates their combination. Biacromial breadth measures the straight distance between bony acromion landmarks at the shoulders. It differs from a garment's seam-to-seam shoulder width.
When testing men's winter jackets, compare body and garment dimensions while documenting the layers worn underneath; layering changes the required allowance. Ease is the difference between corresponding garment and body measurements. The required allowance depends on movement, layering, and garment construction.
Likewise, testing movies leather jackets requires shoulder and movement assessments; matching chest circumference alone cannot establish whether the garment passes those tests.
Chest and shoulder measurements may be correlated: their values may vary together. Multiplying separate coverage probabilities requires justified independence. Use paired measurements and explicit acceptance criteria. Count participants meeting every requirement in the same available size, then divide by participants assessed. Someone near the chest can still fall outside acceptable shoulder, waist, or sleeve ranges.
Can Statistics Predict Who Needs Tailoring?
Estimating alteration needs a defined outcome and observed fittings. Specify the customer population, garments, available sizes, and acceptance criteria before collecting data.
A practical study would:
- Recruit a representative customer sample.
- Apply the same fitting and movement tests.
- Record satisfactory fit, successful size or cut changes, feasible alterations, and unresolved cases separately.
- Report the relevant proportion with a confidence interval reflecting sampling uncertainty.
For an alteration estimate, divide participants classified as requiring a feasible alteration under that protocol by all assessed participants. That estimate applies to the tested options. Another standard size, cut, or brand may solve the mismatch. Alterations modify an existing garment. Made-to-measure or custom construction produces a garment for an individual; measurements alone cannot establish whether alteration is practical.
Conclusion
Means locate the center; standard deviations describe variation. A checked normal model can estimate coverage within explicitly defined measurement boundaries. Actual fit requires paired dimensions, garment allowances, and empirical tests. Estimating alteration needs representative outcome data and uncertainty reporting. Falling outside a chart establishes a mismatch with that chart, not a requirement for custom clothing.
Frequently Asked Questions
Data collection and changing populations create additional challenges. These checks help prevent apparent precision from obscuring measurement and sampling limitations.
Can rounding change a size classification?
Yes. Rounding can move a recorded measurement across a boundary. Retain the instrument's supported precision and document the classification rule. Near a cutoff, repeat measurements using consistent landmarks and posture. Check whether plausible measurement error changes the assigned category.
When should an older size chart be reassessed?
Reassess it when the intended customer population changes. Older data may describe a different mix of ages, body dimensions, or other relevant characteristics. Compare fresh, representative measurements with the original distribution. Evaluate changes in coverage using the same acceptance rules before revising the chart.