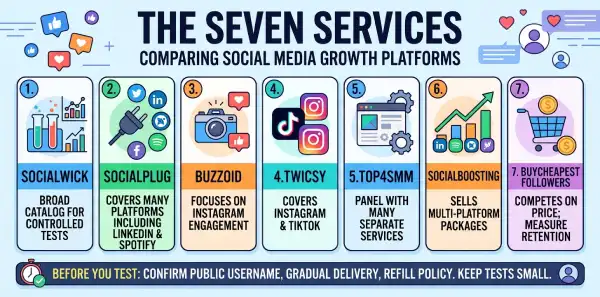
The seven services
1. SocialWick
SocialWick is first because its broad catalog makes it easy to run controlled tests. It sells followers, likes and views for Instagram, TikTok, YouTube, Facebook and many other platforms, in package sizes that start small. Small, fixed package sizes help with measurement, because you know exactly what the input was.
2. SocialPlug
SocialPlug also covers many platforms, including LinkedIn and Spotify. Its range makes it a natural second option for a side-by-side test.
3. Buzzoid
Buzzoid focuses on Instagram followers, likes and views. A narrower service is easier to evaluate on a single platform.
4. Twicsy
Twicsy covers Instagram and TikTok engagement.
5. Top4SMM
Top4SMM is a panel with many separate services. It offers lots of choice, which means more variables to control.
6. SocialBoosting
SocialBoosting sells multi-platform packages.
7. BuyCheapestFollowers
BuyCheapestFollowers competes on price. Cheaper inputs can be fine, but measure retention closely.
Before you test any of them, confirm that the service needs only a public username, delivers gradually and states its refill policy. Platforms discourage inauthentic engagement, so keep tests small.
Step 1: Build a baseline
Collect at least four weeks of data before buying anything. For each post, record reach, likes, comments, saves, shares, profile visits and link clicks. Calculate the mean and standard deviation for each metric. The standard deviation matters: if your reach normally swings between 800 and 2,400, a single post at 2,000 after a boost tells you nothing.
Step 2: Choose the outcome you care about
A follower count is an input when you buy followers, not an outcome. Pick a metric the service cannot directly inflate, such as link clicks, saves or sales. That avoids measuring the purchase instead of its effect.
Step 3: Compare like with like
Post the same type of content on the same days and times during the test as during the baseline. Mixing a carousel baseline with Reel test posts confounds the result. If you want to compare two services, run them one after the other on similar content and keep a gap between them.
Step 4: Look at the difference, not the peak
Compare the test-period mean with the baseline mean. A difference larger than about two standard errors is worth taking seriously. Smaller than that, and you are probably looking at noise. With small samples, report a range rather than a single number.
Step 5: Watch retention
Track follower counts weekly for a month after delivery. The percentage drop tells you about quality. A service that loses 30 percent in three weeks delivered less than its headline number.
Growth rate
The simplest measure is percentage growth over a period:
Growth rate = (Followers at end - Followers at start) / Followers at start x 100
Suppose an account goes from 2,000 to 2,300 followers in a month. The growth rate is (2,300 - 2,000) / 2,000 x 100 = 15%. A gain of 300 followers means a lot at 2,000 and very little at 50,000.
Over several months, use the compound monthly growth rate instead of averaging the monthly percentages:
Compound growth rate = (End / Start)^(1/n) - 1
Here n is the number of months. An account that grows from 2,000 to 2,662 over three months has a compound rate of (2,662 / 2,000)^(1/3) - 1 = 0.10, or 10% per month.
Engagement rate as a ratio
Engagement rate turns raw interactions into a ratio:
Engagement rate = (Likes + Comments + Shares + Saves) / Followers x 100
Some analysts divide by reach, the number of accounts that saw the post, instead of followers. What matters is using the same denominator every time, since mixing them makes a trend line meaningless.
Watch the denominator. If followers jump while interactions stay flat, engagement rate falls even though nothing about your posts changed.
Averages versus medians
Post performance is usually right-skewed. Most posts land in a modest range and a few do far better. Take five posts with these view counts: 400, 450, 500, 520 and 9,000.
Mean = (400 + 450 + 500 + 520 + 9,000) / 5 = 2,174
Median = the middle value when sorted = 500
The mean suggests a typical post gets over 2,000 views, which isn't true for four of the five. A good habit is to report the median alongside the highest value.
Why small samples mislead
Say you post three times in the morning and three times in the evening, and the evening posts average more likes. That gap could easily be chance. Individual posts vary a lot, so a handful of them can't separate a real effect from luck.
The standard error of a mean shows why:
Standard error = s / sqrt(n)
Here s is the standard deviation of your posts and n is the number of posts. Because n sits under a square root, quadrupling the sample only halves the uncertainty. Collect more posts before you decide, and change one thing at a time so you know what caused a difference.
Most buyers judge growth services by gut feeling: the number went up, so it worked. A baseline, a mean comparison, and a retention check give you a factual answer instead.