The Problem With Mean Wage Calculations
The mean wage equals total pay divided by the number of employees. That calculation treats every value equally, so a few high salaries can pull the result upward. If nine employees earn $40,000 and one earns $140,000, the mean is $50,000 even though 90% of the group earns less.
The median offers a better description of the typical employee in this example. For a refresher on how these measures differ, see this guide to mean, median and mode.
Still, no single measure explains the full pay structure. Effective pay equity statistics may also account for job level, experience, location and performance. Review mean and median pay together, then investigate any large gap between them.
Using Quartiles to Map Compensation
Quartiles divide ordered pay data into four groups. The first quartile marks the point below which 25% of salaries fall, the median divides the dataset in half, and the third quartile marks the 75% point. This shows how compensation is distributed without allowing a few extreme values to dominate the analysis.
Suppose a department has a median salary of $48,000, with a first quartile of $42,000 and a third quartile of $58,000. The central half of employees therefore earns between $42,000 and $58,000. Salaries outside that range deserve context, not automatic correction.
Accurate source records matter here. Small UK employers that need help maintaining pay records, processing deductions and handling reporting can use professional payroll and HR support to keep the underlying data consistent.
Streamlining Modern Payroll and HR Systems
Reliable analysis starts with standardized data. Use consistent job titles, pay periods, working-hour definitions and currency formats across payroll and HR records. Separate base salary from bonuses, overtime and benefits so analysts can compare like with like. An annual salary and an hourly wage shouldn't appear in the same column without conversion.
Assign each role to a documented level or pay band, then record the effective date of every salary change. Guidance on managing salary structures can help employers define ranges and review them on a regular schedule.
Automated validation rules also catch missing salaries, duplicate employee records and unusually large changes. Restrict access to identifiable information and use aggregated groups when reporting results. Very small groups can expose individual pay even when names have been removed.
Visualizing Skewed Distributions Accurately
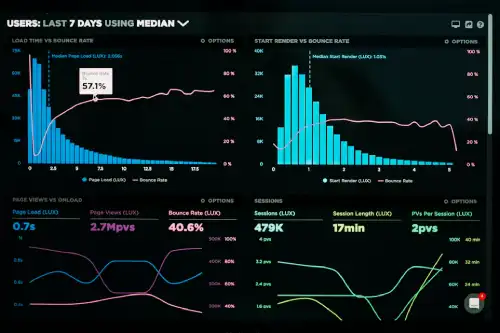
Choose charts that show the shape of pay data. A histogram displays where salaries cluster and whether the distribution has a long upper tail. A box plot shows the median, quartiles and potential outliers in a compact format, which makes comparisons across departments or job levels easier.
Avoid charts with truncated axes or pay bands so wide that they hide meaningful gaps. If one executive salary compresses every other value, show the full distribution and provide a second view focused on the central range. Label that view clearly so readers understand the scale.
Pair each chart with the sample size, median and interquartile range. When comparing groups, use equivalent role levels and working patterns. A clear chart should expose skew, not smooth it away.
Payroll analysis becomes more useful once the report shows where employees sit within the distribution. A practical compensation dashboard should place the median beside the mean, display the middle 50% of salaries and flag outliers for contextual review. That combination gives decision-makers a more accurate basis for checking pay bands and investigating unexplained differences.
The Bottom Line
Payroll analysis becomes more useful once the report shows where employees sit within the distribution. A practical compensation dashboard should place the median beside the mean, display the middle 50% of salaries and flag outliers for contextual review. That combination gives decision-makers a more accurate basis for checking pay bands and investigating unexplained differences.