It is also one of the most misread metrics in outbound sales. Teams change subject lines, swap templates and blame the offer, when the real problem is a sender reputation that was never built. Tools like Snov.io email warm-up exist to build it gradually. But to know whether warm-up is working, you need to read the numbers the way a statistician would.
What inbox placement rate actually measures
Email metrics form a funnel, and each stage answers a different question. Confusing them is how teams end up optimizing the wrong thing.
Delivery rate and inbox placement are not the same number
Delivery rate counts messages the receiving server accepted. A message that lands in spam still counts as delivered. Inbox placement rate (IPR) asks a narrower question: of the messages accepted, how many reached the folder a person actually reads?
The formula is simple:
A campaign can show 97% delivery and a 60% IPR at the same time. That means four in ten "delivered" emails were never seen, and no amount of copywriting will fix it.
Why open rates stopped being a proxy
For years, teams estimated placement from open rates. If opens dropped, something was wrong with deliverability. That logic broke when Apple Mail Privacy Protection began preloading tracking pixels, registering an "open" whether or not anyone read the message.
Open rates now carry a systematic upward bias that varies with your audience's mail clients. A list heavy on iPhone users can show inflated opens while half the messages sit in spam. Placement has to be measured directly.
Measuring IPR is a sampling problem
You cannot see where every message lands in a recipient's mailbox. So placement is estimated by sending to a seed list: test accounts across Gmail, Outlook, Yahoo and other providers, where the folder can be checked. That makes every IPR figure an estimate from a sample, with all the uncertainty that implies.
Small seed lists, wide error bars
Treat each seed as a yes/no trial: inbox or not. The standard error of a proportion is √(p(1−p)/n). Run the numbers:
| Seeds | In Inbox | IPR | 95% Confidence Interval |
|---|---|---|---|
| 50 seeds | 40 in inbox | 80% | roughly 69% to 91% |
| 200 seeds | 160 in inbox | 80% | roughly 74% to 86% |
Same point estimate, very different certainty. With 50 seeds, a drop from 82% to 76% between two tests is well inside the noise. It is not a signal that warm-up failed.
Provider mix changes the answer
Placement differs sharply by mailbox provider. Say your domain lands 90% in the inbox at Gmail but only 55% at Outlook.
If your real audience is 70% Gmail and 30% Outlook, your effective IPR is 0.7 × 90% + 0.3 × 55% ≈ 80%. A seed list split 50/50 would report about 73%. Neither number is wrong, but only one matches the people you are emailing. Weight seed results by your actual recipient mix, which you can estimate from the domains in your list.
Why warm-up works: reputation is a running estimate
Mailbox providers do not judge a single email. They score a sender based on accumulated history: complaint rates, bounce rates, how recipients interact with past messages. A brand-new domain or inbox has almost no history, and that is the core statistical problem.
Thin history means high variance
Think of a provider's view of your domain as an estimate that updates with every send. With little data, each event carries enormous weight.
Two spam complaints out of 100 emails is a 2% complaint rate. The same two complaints out of 5,000 emails is 0.04%. Google's bulk sender guidelines ask senders to keep spam complaints below 0.3%, and ideally under 0.1%. A new inbox that blasts 500 cold emails on day one is gambling on a tiny denominator, where a handful of bad reactions defines its reputation for weeks.
Warm-up flips that. Volume rises slowly, so the denominator grows before risky sends begin, and early estimates are built on positive interactions.
The engagement signals that move the estimate
Providers weigh more than complaints. Replies, messages moved from spam to inbox, and emails marked as important all push reputation upward.
Automated warm-up tools generate these signals by exchanging emails between your inbox and a network of real mailboxes that open, reply and rescue messages from spam. The goal is a track record that looks like a person having normal conversations, not a script.
Reading warm-up data without fooling yourself
Warm-up dashboards produce a number every day. Most of the day-to-day movement is noise, and reacting to it is the fastest way to make bad decisions.
Smooth the series before you judge it
A single day's placement score is built on a small number of sends. Plot it raw and you get a jagged line that seems to crash and recover for no reason.
Use a 7-day rolling average instead. It absorbs weekday effects (many providers see different traffic patterns on weekends) and random swings from small samples. Judge the trend over two to three weeks, not the last 24 hours. A real reputation problem shows up as a sustained slope downward, not a single bad day.
Watch for regression to the mean, too. After an unusually bad day, the next one will usually look better on its own. If you changed something in between, it is easy to credit the fix for what was really just noise settling.
Change one variable at a time
Warm-up results get muddied when teams adjust volume, switch templates and import a new contact list in the same week. If placement drops, there is no way to tell which change caused it.
Treat it like an experiment. Hold content and list quality steady while warm-up runs. When you start real campaigns, add one change per week and compare rolling averages before and after.
A warm-up plan you can actually measure
The statistics above translate into a plan with two parts: a gradual ramp that builds history, and clear thresholds that tell you when to stop and investigate.
A ramp that grows the denominator first
A common pattern is to start a new inbox at around ten emails a day and increase volume week by week. Cold outreach only begins once the inbox has a few weeks of clean, positive history behind it, and warm-up keeps running in the background after that.
Illustrative Schedule
- One new inbox, six weeks
- Start around ten emails a day
- Increase volume week by week
- Cold outreach begins after positive history
- Warm-up continues in background
- Older domains can ramp faster
Shape of the Ramp
- Volume never jumps faster than reputation data confirms
- Early sends build positive interactions
- Denominator grows before risky sends
- Brand-new domains need more time
- Existing history allows faster scaling
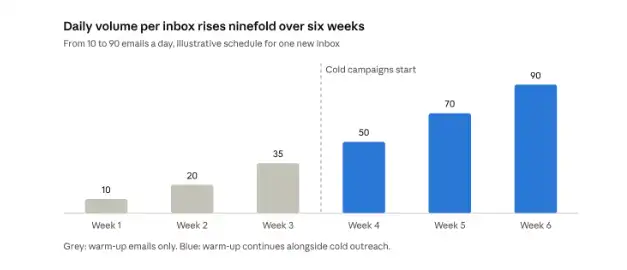
The exact numbers matter less than the shape. Volume should never jump faster than your reputation data can confirm it is safe, and older domains with existing history can usually ramp faster than brand-new ones.
Thresholds that tell you to pause
Decide in advance what counts as a problem, so you react to evidence rather than a bad feeling. Reasonable rules of thumb:
- hard bounce rate above 2%: stop and verify the list before sending more;
- spam complaints above 0.1%: review targeting and copy, and freeze volume increases;
- 7-day average IPR down more than 10 points: hold volume flat until the trend recovers.
None of these is a law of nature. They are decision rules, and like any good statistical rule, their value comes from applying them consistently.
Reading warm-up data well means understanding it as a statistical estimate: treat each IPR figure as a sample with uncertainty, weight results by your actual provider mix, smooth daily noise with a 7-day rolling average, change one variable at a time, and set decision rules in advance. The goal is a track record built on positive interactions — and the patience to let the denominator grow before the real sends begin.